


Report, page 1 of 48 — Title page
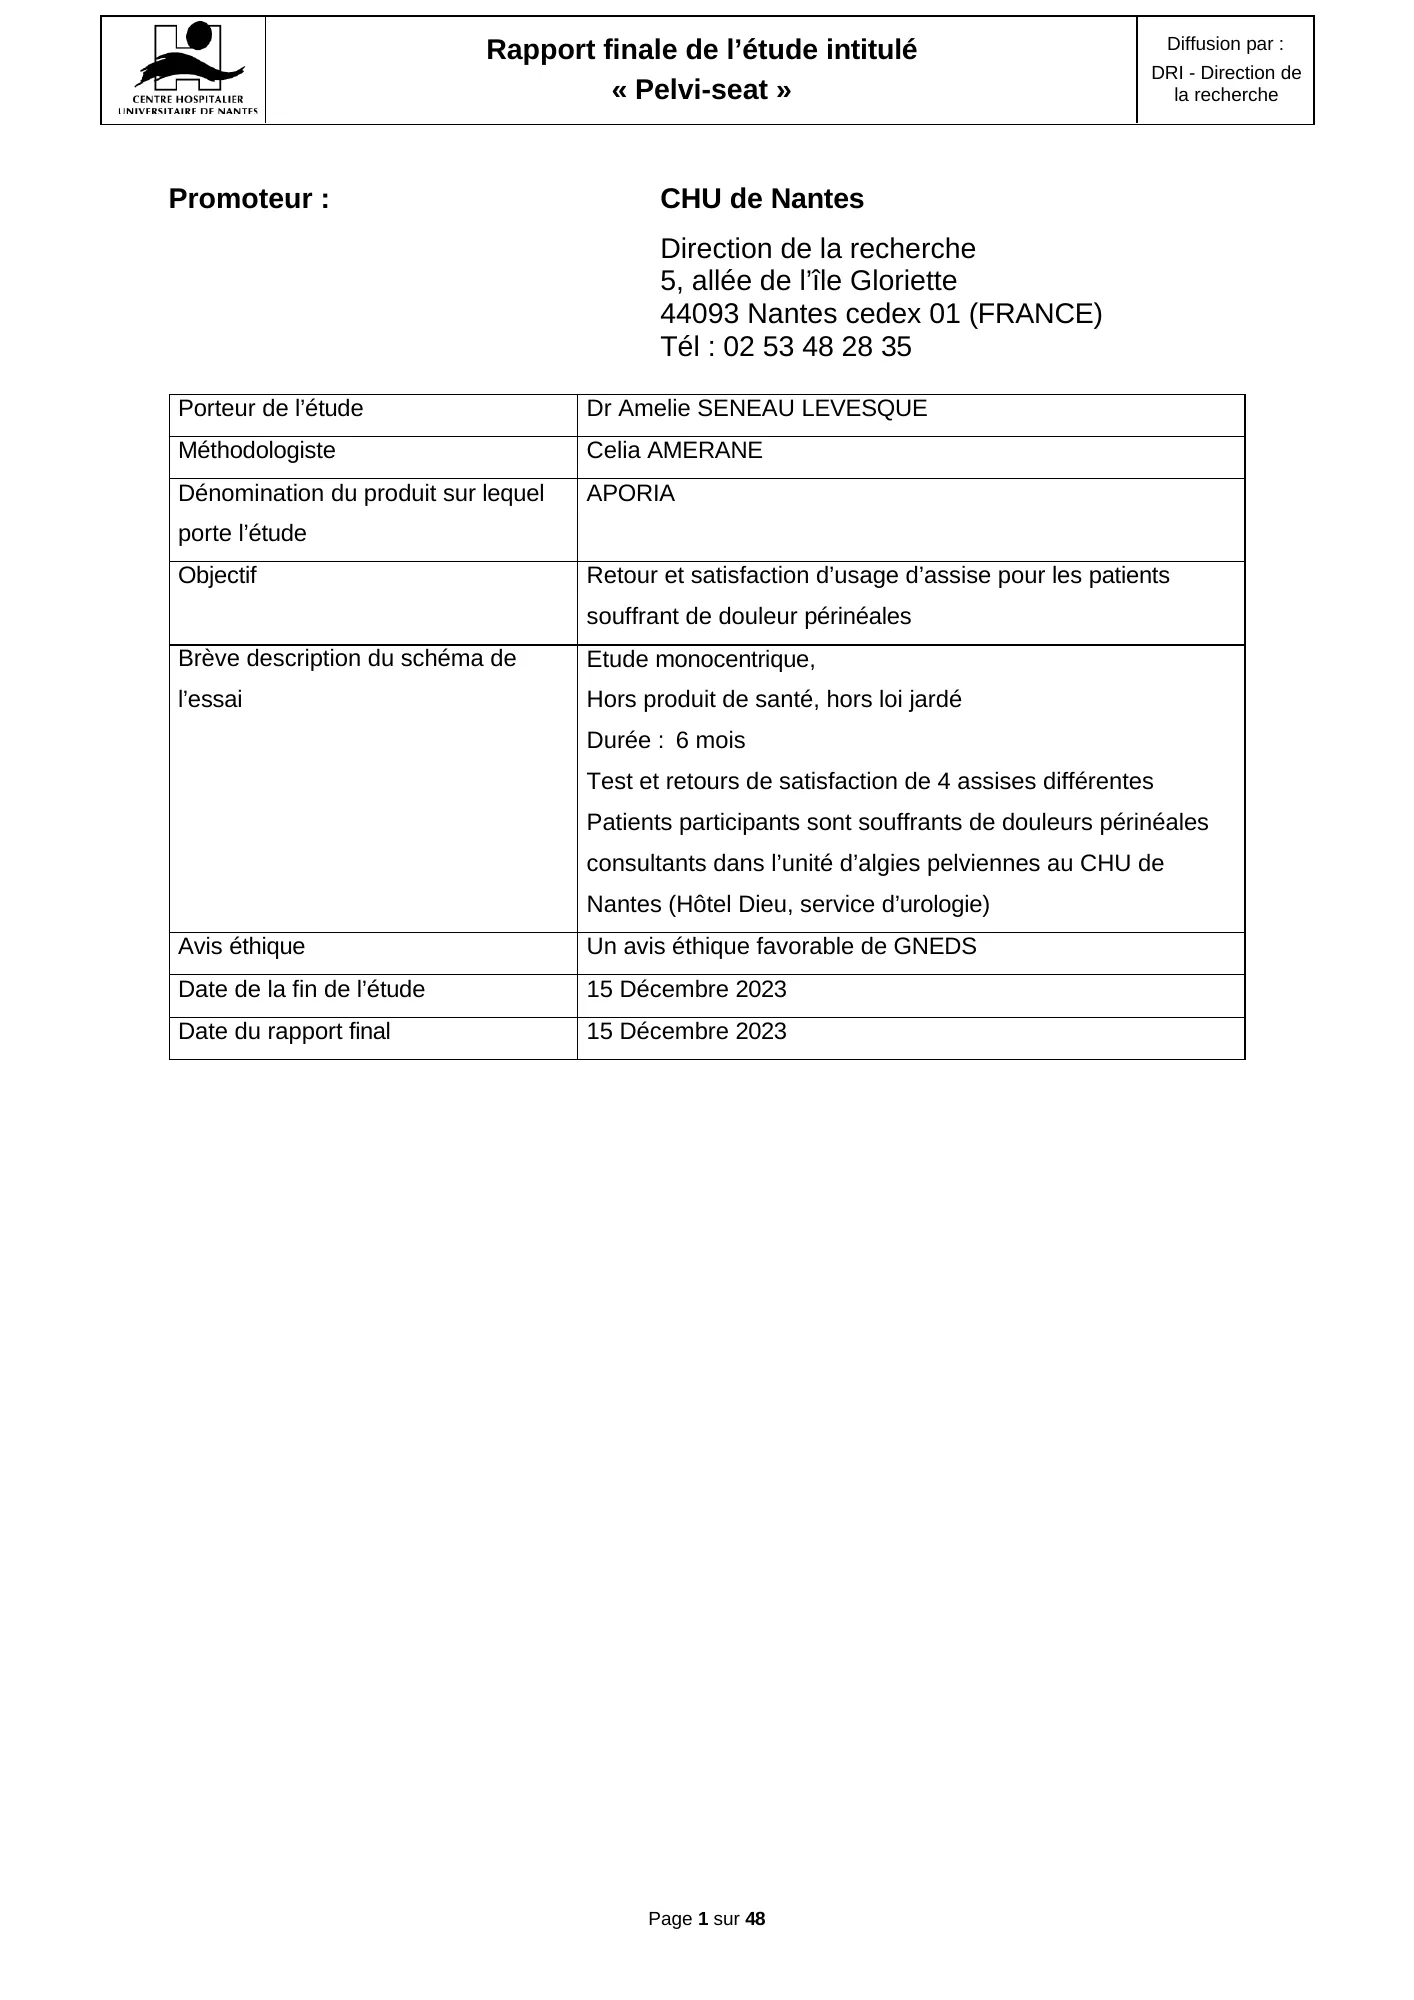
| Sponsor: | CHU de Nantes Research Department 5, allée de l’île Gloriette 44093 Nantes cedex 01 (FRANCE) Tel.: +33 2 53 48 28 35 |
|---|
| Study lead | Dr Amelie SENEAU LEVESQUE |
|---|---|
| Methodologist | Celia AMERANE |
| Name of the product studied | APORIA |
| Objective | Feedback and user satisfaction with seating for patients suffering from perineal pain |
| Brief description of the study design | Single-center study, Not a health-product study, outside the Jardé law Duration: 6 months Testing and satisfaction feedback on 4 different seats Participating patients suffer from perineal pain and attend the pelvic pain unit at CHU de Nantes (Hôtel Dieu, urology department) |
| Ethics opinion | A favorable ethics opinion from GNEDS |
| Study end date | December 15, 2023 |
| Final report date | December 15, 2023 |
View the original page (page 1 of the report, in French)
Page 1 — Title page of the Pelvi-Seat final report: single-center study at CHU de Nantes (sponsor), study lead Dr Amélie Seneau Lévesque, user satisfaction with 4 seats among patients with perineal pain, favorable ethics opinion from GNEDS.
Report, page 2 of 48 — Table of contents
TABLE OF CONTENTS
- List of abbreviations — 3
- I. Introduction — 4
- II. Results — 7
- 1. Description of the sample of data analyzed — 7
- 2. Demographic characteristics — 8
- i. Sex — 8
- ii. Age — 8
- iii. BMI — 8
- iv. Département of residence — 9
- 3. Use of products already on the market — 9
- i. Use of seating in daily life — 9
- ii. Prices and models — 10
- iii. Level of satisfaction — 10
- iv. Improvement criteria — 11
- 4. Evaluation of the use of the seats tested — 11
- i. Results for the total sample (95 questionnaires) — 11
- 1. User satisfaction — 11
- 2. Pain while seated — 15
- 3. Order of preference — 17
- 4. Movement and comfort — 22
- ii. Results for the complete sample (55 questionnaires) — 31
- 1. User satisfaction — 31
- 2. Pain while seated — 34
- 3. Order of preference — 37
- 4. Movement and comfort — 40
- i. Results for the total sample (95 questionnaires) — 11
- III. Discussion and Conclusion — 48
View the original page (page 2 of the report, in French)
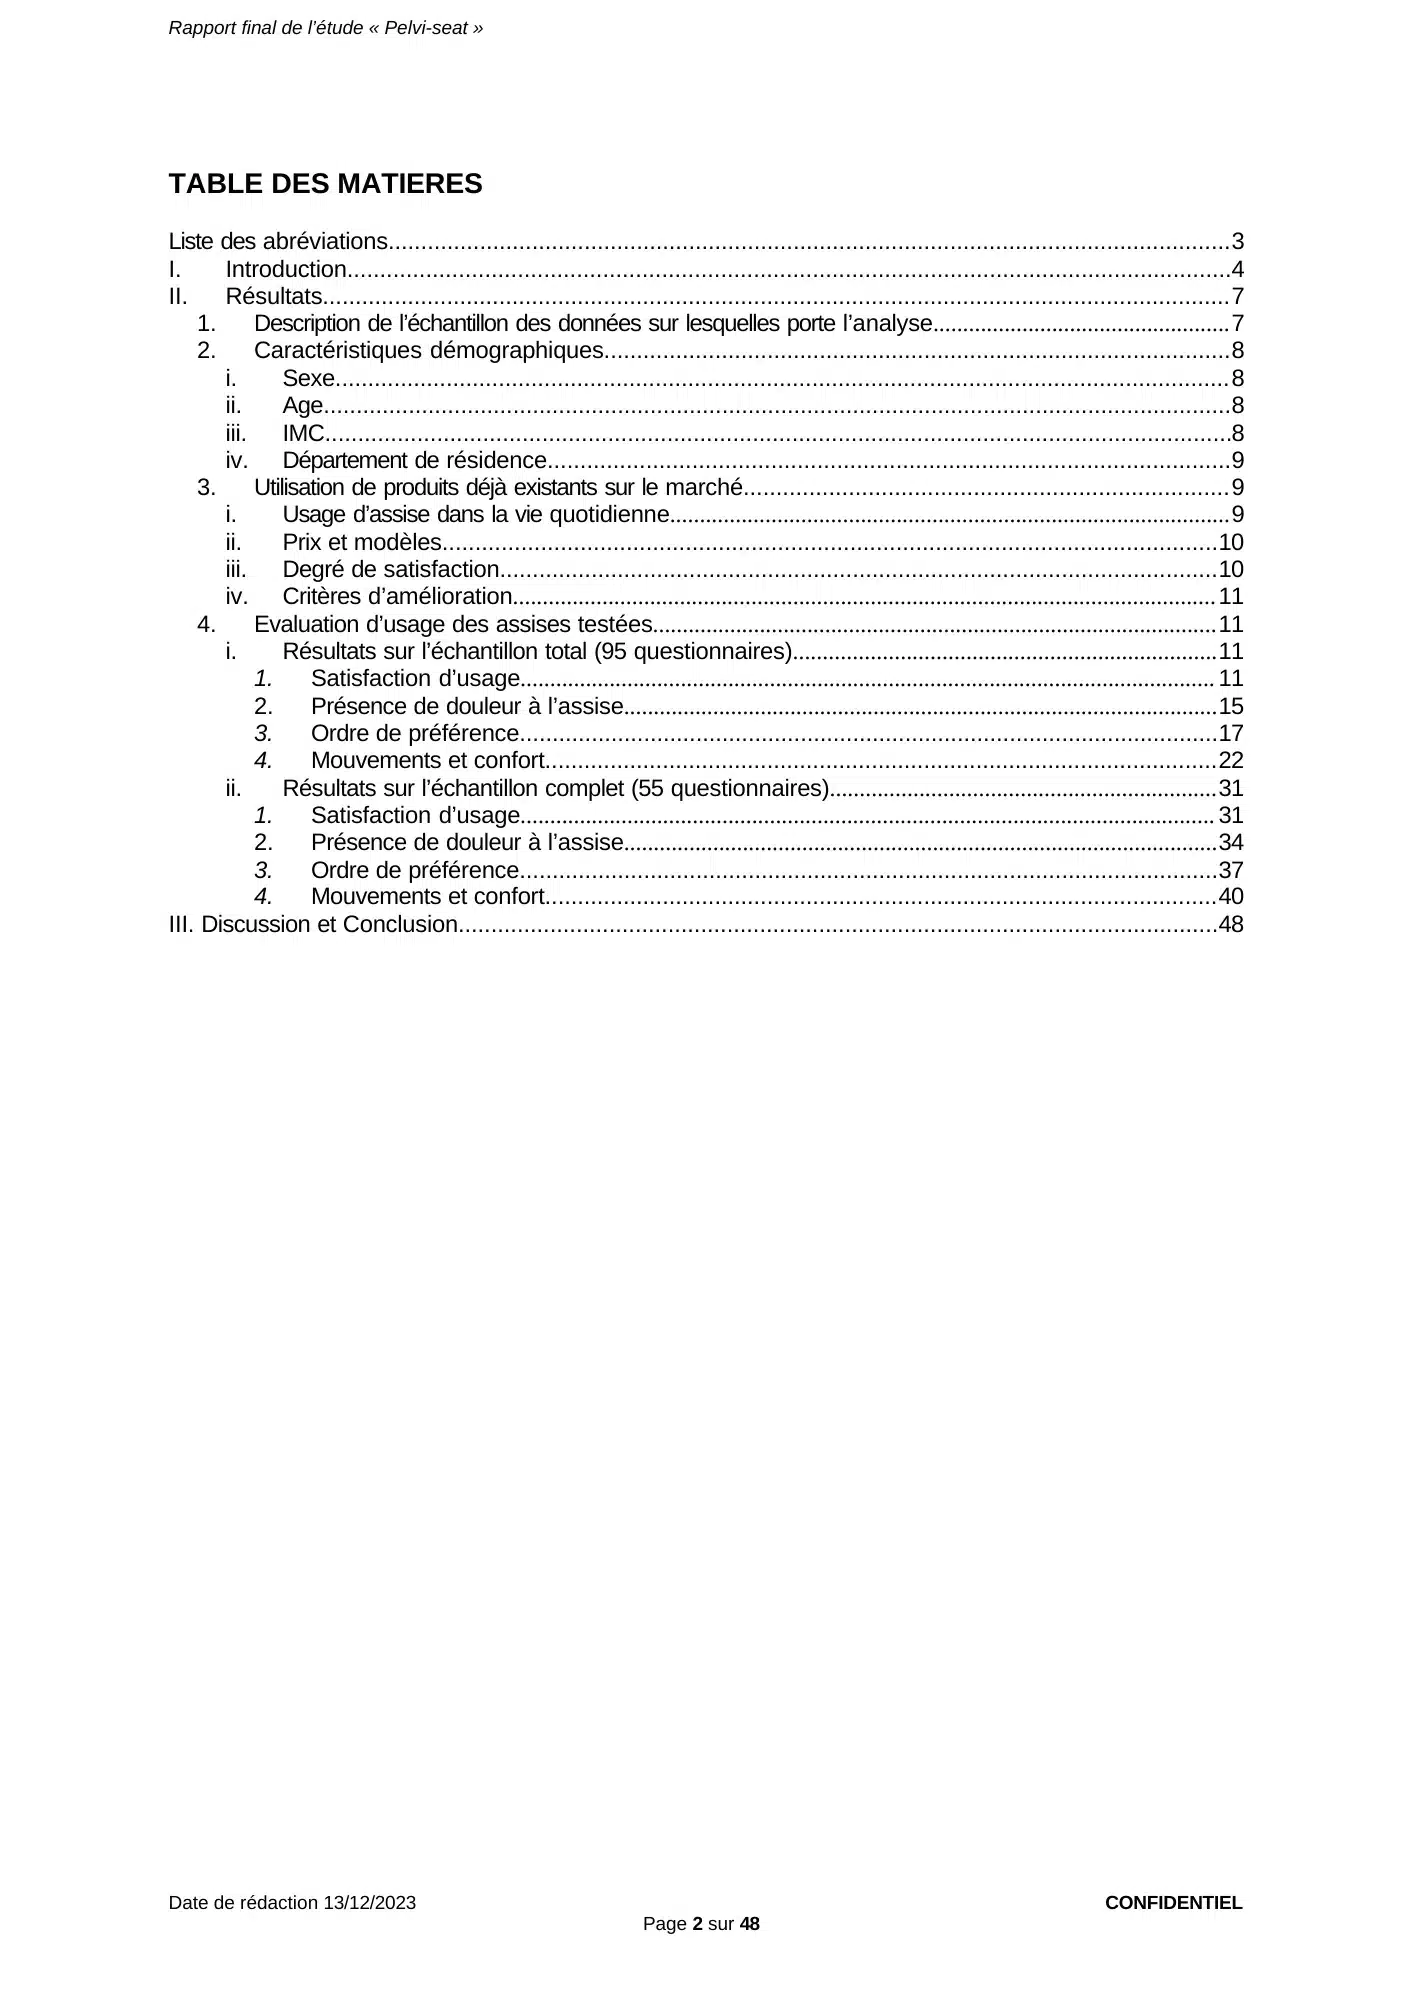
Page 2 — Table of contents: introduction, results for the total sample (95 questionnaires) and for the complete sample (55 questionnaires), discussion and conclusion.
Report, page 3 of 48 — List of abbreviations
LIST OF ABBREVIATIONS
| GNEDS | Groupe nantais d’éthique dans le domaine de la santé (Nantes health ethics group) |
|---|---|
| Rep. | Answer |
| Eff. | Effectif (count) |
| %Eff. Rep | Percentage of respondents |
| % Eff.Tot | Percentage of the total count |
View the original page (page 3 of the report, in French)
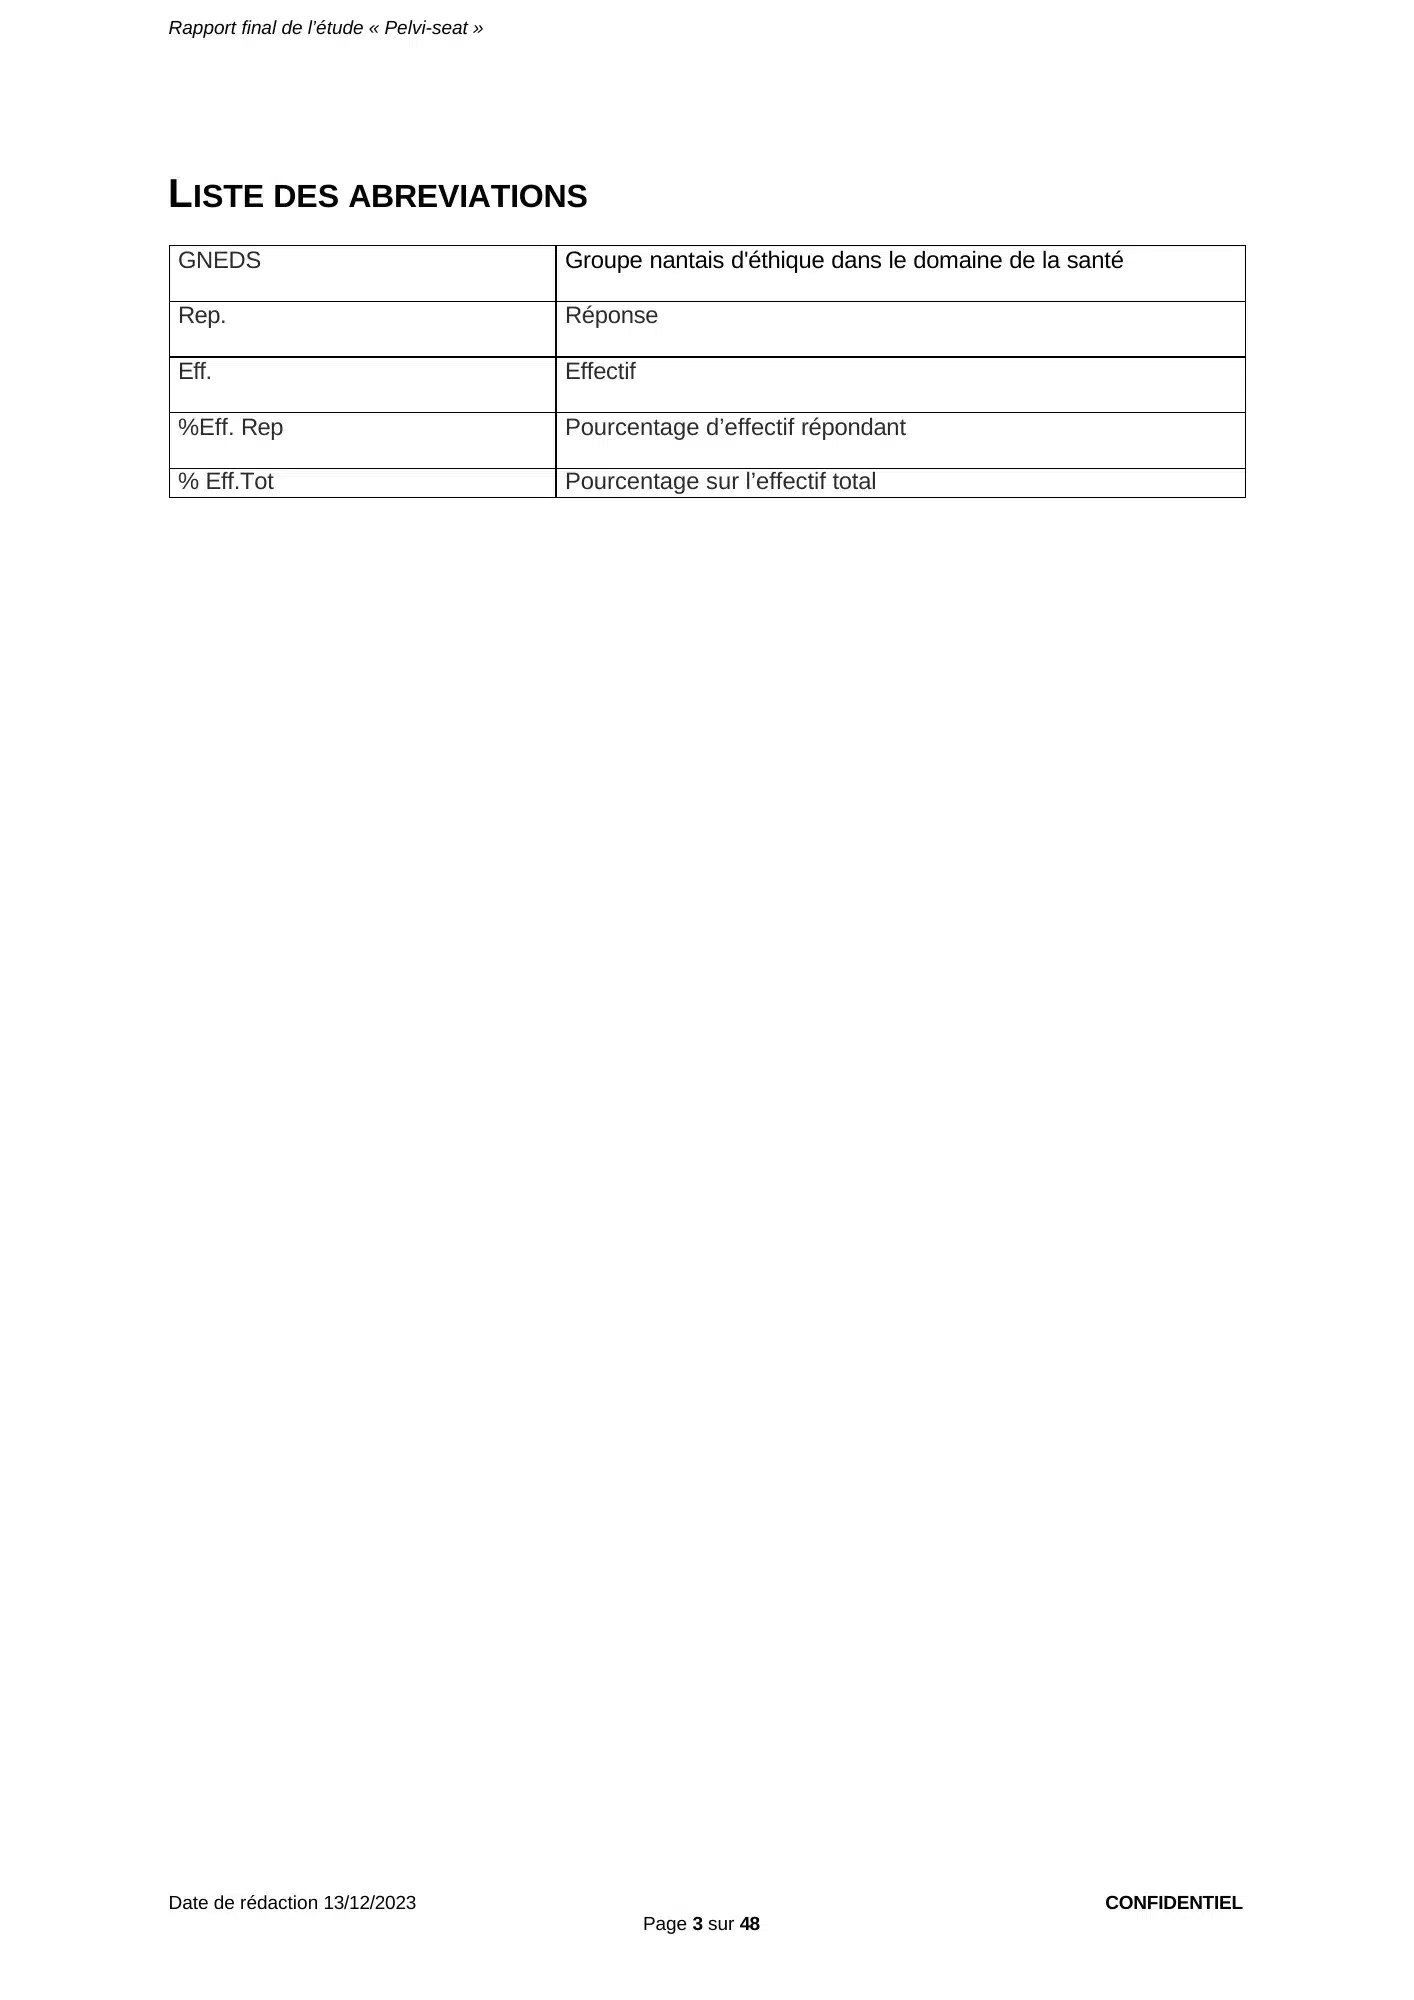
Page 3 — List of abbreviations used in the report (GNEDS, counts, percentages of respondents).
Report, page 4 of 48 — Introduction
I. Introduction
Most chronic pelvic and perineal pain is accompanied by an inability to remain seated for long periods, with obvious repercussions on quality of life (meals, travel and work). One of the first medical recommendations is to use a seat that off-loads the painful points. Yet no study has demonstrated the effectiveness of such seats in this population. It is therefore necessary to consider developing suitable devices and evaluating them rigorously in patients with chronic pelvic-perineal pain.
The APORIA seat is intended to provide lasting relief of sitting pain in the sacral, coccygeal and perineal areas and lasting comfort for people with pelvic-perineal pain. This product is not a medical device.
This pilot study, outside clinical research, aims to obtain feedback from potential users on the benefits and comfort of the APORIA® seat in order to identify possible improvements.
This is the final report of the study, including the study results.
1. Reminder of the study objectives
The main objective of this survey was user feedback on the use of the APORIA chairs by patients with chronic pelvic-perineal pain, by assessing the sitting comfort of the APORIA chairs compared with the other chairs in the waiting room of the urology department at CHU de Nantes.
In addition to the main objective of the study, population characterization data (sex, BMI, age, département of residence…) were collected; the results are presented for the total sample (95 questionnaires) in the first part of the report.
The questionnaire covers all the evaluation criteria of the study, and this report presents all the data collected with this questionnaire during the 5 months of testing of the APORIA chairs.
2. Information on the products studied
The partner is a young French company specializing in the design, development and marketing of comfort and well-being products. The APORIA seats are developed by the company Blueportance. The APORIA chairs are intended to provide lasting relief of sitting pain in the sacral, coccyx and perineal areas and, in particular, lasting comfort for people with pelvic-perineal pain.
This product consists of hard parts articulated with one another and includes in particular:
- 1 thermoformed base
- 4 thermoformed pads
- Foam layers providing support and comfort on top of the pads,
View the original page (page 4 of the report, in French)
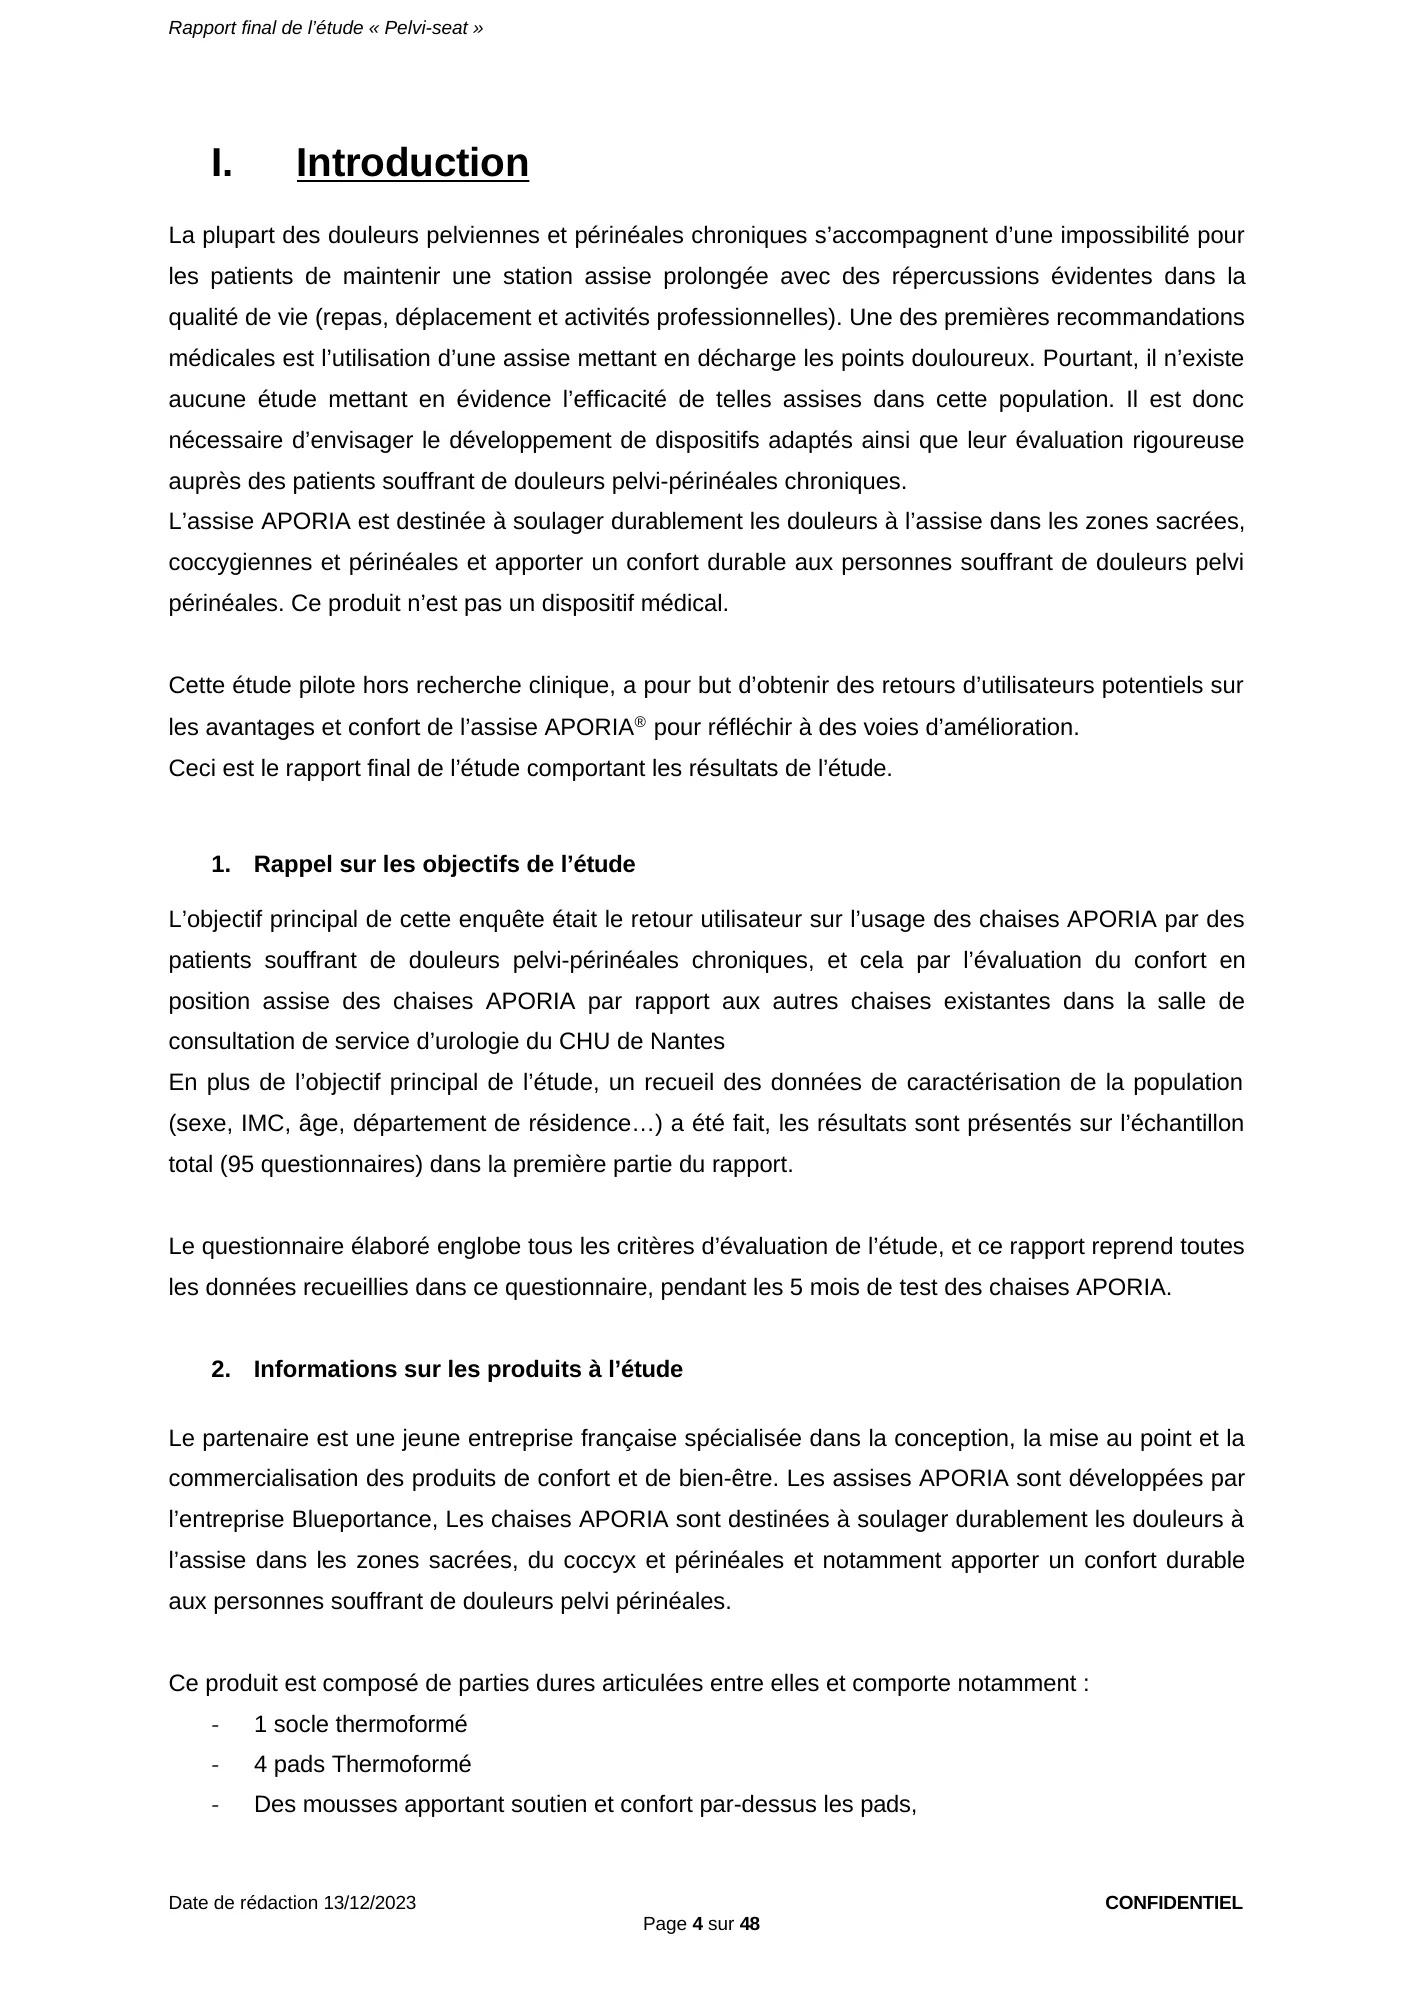
Page 4 — Introduction: chronic pelvic and perineal pain often makes prolonged sitting impossible; no study has evaluated off-loading seats; objectives of the study of the Aporia® seat.
Report, page 5 of 48 — Products studied and methodology
- 1 cushion cover (83% cotton, 14% polyester, 3% elastane) / or four covers, one on each pad fitted with its foam;
- 2 wedges
For the purposes of the study, the Aporia seat was specifically mounted on a height-adjustable base.
The company Blueportance provided two APORIA seats with different ergonomic characteristics: APORIA N°1 (“Chair 2” in the study), designed to relieve pudendal pain, and APORIA N°2 (“Chair 4” in the study), designed to relieve coccyx pain.
3. Methodology and research design
3.1 Description of the research design and brief description of the methodology
- Not a health-product study, outside the Jardé law
- Single-center study
The study took place in the waiting room of the pelvic pain clinic at CHU de Nantes (Hôtel Dieu, urology department).
Patients were invited to test four different seats (a hard seat, a padded seat, and two Aporia® seats under development) and to complete a satisfaction questionnaire covering all the evaluation criteria mentioned above. Trays were placed in the waiting room so that patients could take the questionnaires and return them, completed, on their own.
Testing the seats and completing the questionnaire took 15 minutes.
3.2 Description of the study participants
Adult patients with pelvic or perineal pain in the sitting position (perineal neuralgia, coccydynia, myofascial syndromes, low-back and buttock pain…) waiting in the waiting room for their consultations in the department.
We collected 95 questionnaires.
4. Statistical methods planned in the protocol
All analyses were performed with Sphinx and Excel.
All data are described by counts and proportions (%) for each category of the qualitative variables, and by mean, standard deviation, minimum and maximum for the quantitative variables.
Bar charts and pie charts were produced to illustrate the answers to the questions and the comparison of the seats.
5. Hypothesis(es)
The APORIA seats are more comfortable than the waiting-room chairs for patients with chronic pelvic-perineal pain.
View the original page (page 5 of the report, in French)
Page 5 — Description of the seats tested: Aporia® N°1 (chair 2), designed for pudendal pain, and Aporia® N°2 (chair 4), designed for coccyx pain; methodology in the waiting room of the pelvic pain clinic.
Report, page 6 of 48 — Evaluation criteria and description of the sample
- The APORIA seats allow patients who suffer in the sitting position to remain seated
- The APORIA N°1 seat (Chair 2 tested) is preferred by patients with pudendal neuralgia
- The APORIA N°2 seat (Chair 4 tested) is preferred by patients with coccyx pain.
Also assessed: the high comfort and overall satisfaction these 2 seats could provide compared with the seats usually found in waiting rooms and the cushions used by the patients
II. Results
1.[6.] Description of the sample of data analyzed
The total number of questionnaires collected is 95.
55 of 95 questionnaires (57.9%) contain answers to all the evaluation criteria of the study. Of the remaining 40 questionnaires (41.5%): 16 questionnaires were distributed at the very beginning of the study, when the 2nd APORIA seat (for the coccyx) had not yet been included in the study; the questionnaire then covered only three seats: APORIA N°1, the hard chair and the padded chair. The remaining 24 questionnaires contain incomplete answers to questions related to the evaluation criteria of the study.
For accuracy of analysis and interpretation, the results for each questionnaire variable are presented in two groups: the total sample (95 questionnaires), with or without an answer to a given variable, and the complete sample (55 questionnaires), in which patients answered all the questions.
The variable “use of an existing product on the market” and its sub-items (price, seat model, satisfaction, improvement criteria) are not among the evaluation criteria and were not taken into account to form the complete sample; that is, in the complete sample, one or more of these variables may not have been reported.
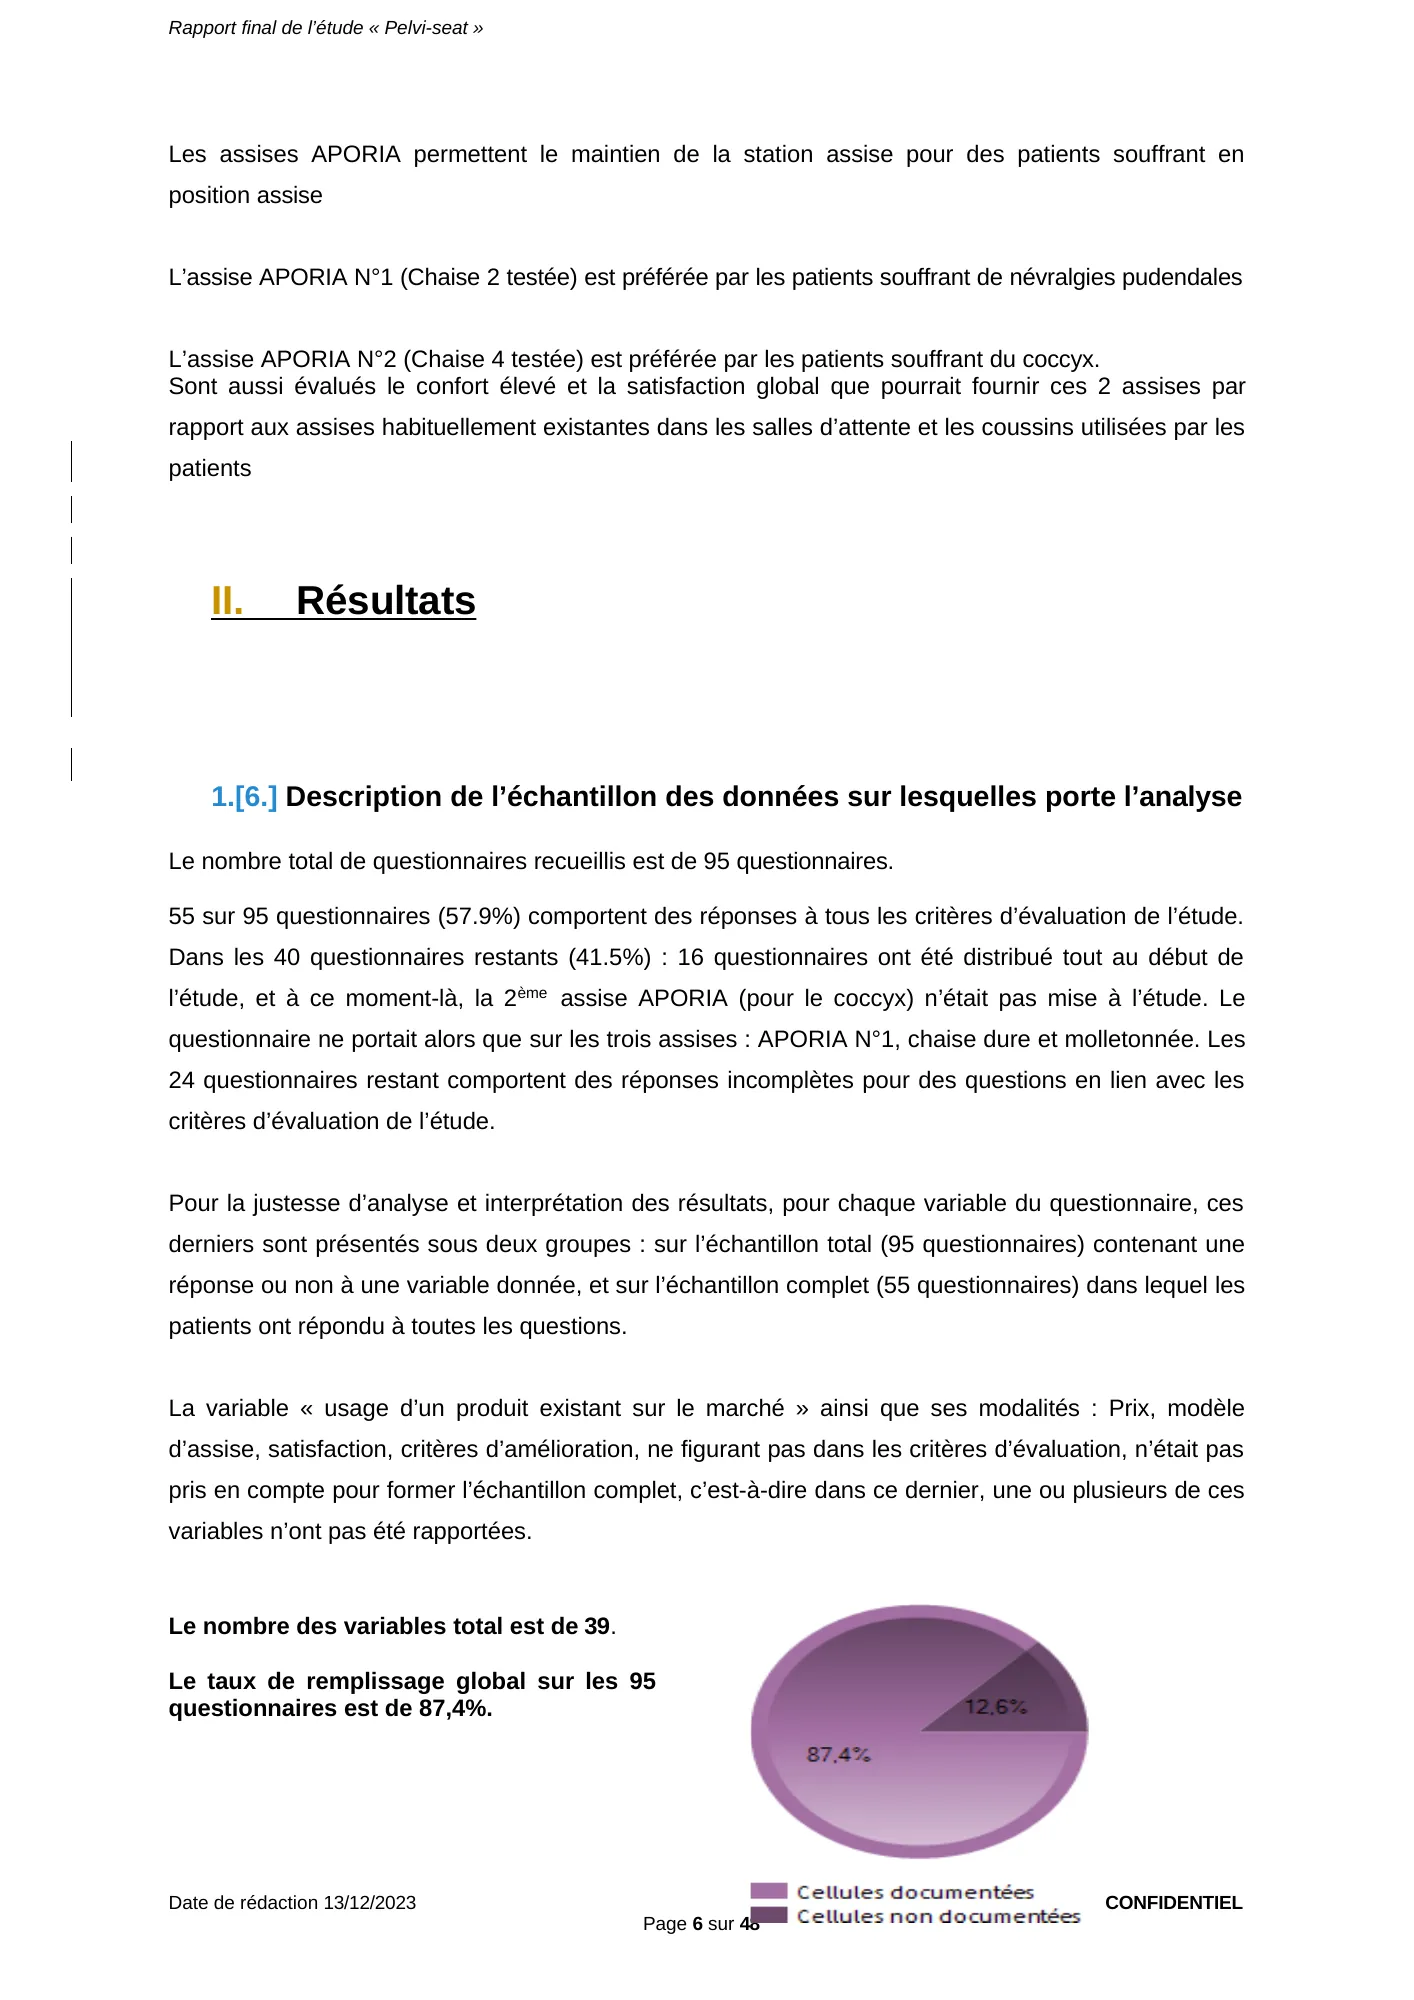
The total number of variables is 39.
The overall completion rate for the 95 questionnaires is 87.4%.
View the original page (page 6 of the report, in French)
Page 6 — Sample: 95 questionnaires collected, 55 of them complete (57.9%); results presented for the total sample (95) and for the complete sample (55); overall completion rate 87.4%.
Report, page 7 of 48 — Demographic characteristics (total sample)
2.[7.] Demographic characteristics
i. Sex:
- Actual responses: 95
- No response(s): 0
- Response rate: 100%
Most of the patients who answered the questionnaire are female.
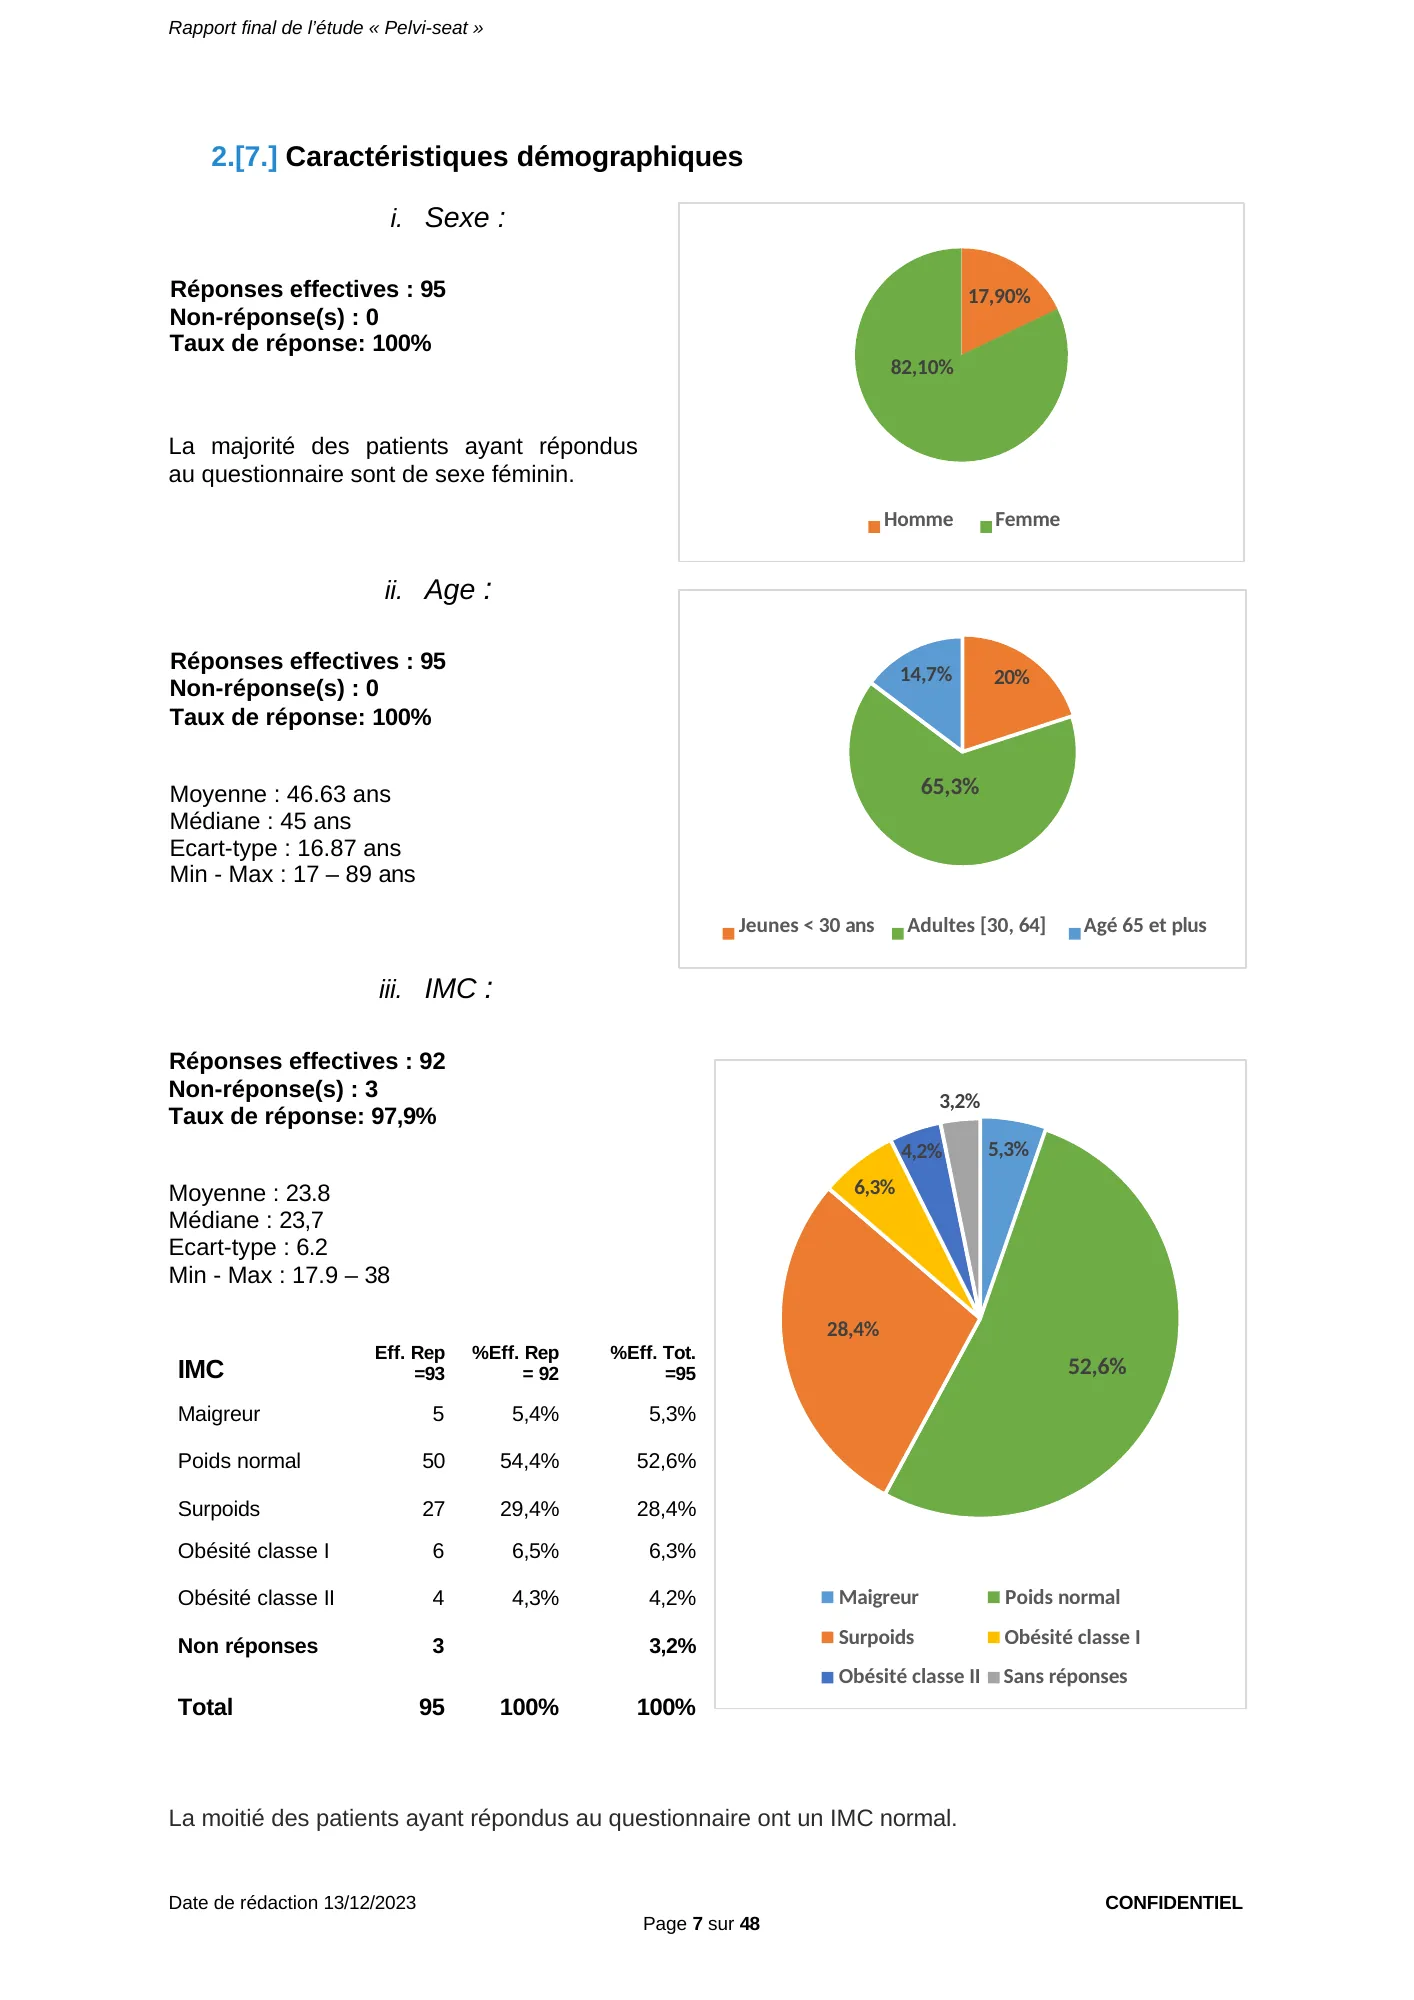
ii. Age:
- Actual responses: 95
- No response(s): 0
- Response rate: 100%
- Mean: 46.63 years
- Median: 45 years
- Standard deviation: 16.87 years
- Min – Max: 17 – 89 years
iii. BMI:
- Actual responses: 92
- No response(s): 3
- Response rate: 97.9%
- Mean: 23.8
- Median: 23.7
- Standard deviation: 6.2
- Min – Max: 17.9 – 38
| BMI | Eff. Rep =93 | %Eff. Rep = 92 | %Eff. Tot. =95 |
|---|---|---|---|
| Underweight | 5 | 5.4% | 5.3% |
| Normal weight | 50 | 54.4% | 52.6% |
| Overweight | 27 | 29.4% | 28.4% |
| Obesity class I | 6 | 6.5% | 6.3% |
| Obesity class II | 4 | 4.3% | 4.2% |
| No response | 3 | 3.2% | |
| Total | 95 | 100% | 100% |
Half of the patients who answered the questionnaire have a normal BMI.
View the original page (page 7 of the report, in French)
Page 7 — Patient characteristics (95 questionnaires): 82.1% women; mean age 46.6 years; mean BMI 23.8 (92 respondents), normal weight for 50 patients (54.4% of respondents).
Report, page 8 of 48 — Département of residence and use of existing seating (total sample)
iv. Département of residence:
- Actual responses: 95
- No response(s): 0
- Response rate: 100%
- Most frequent answer: 44
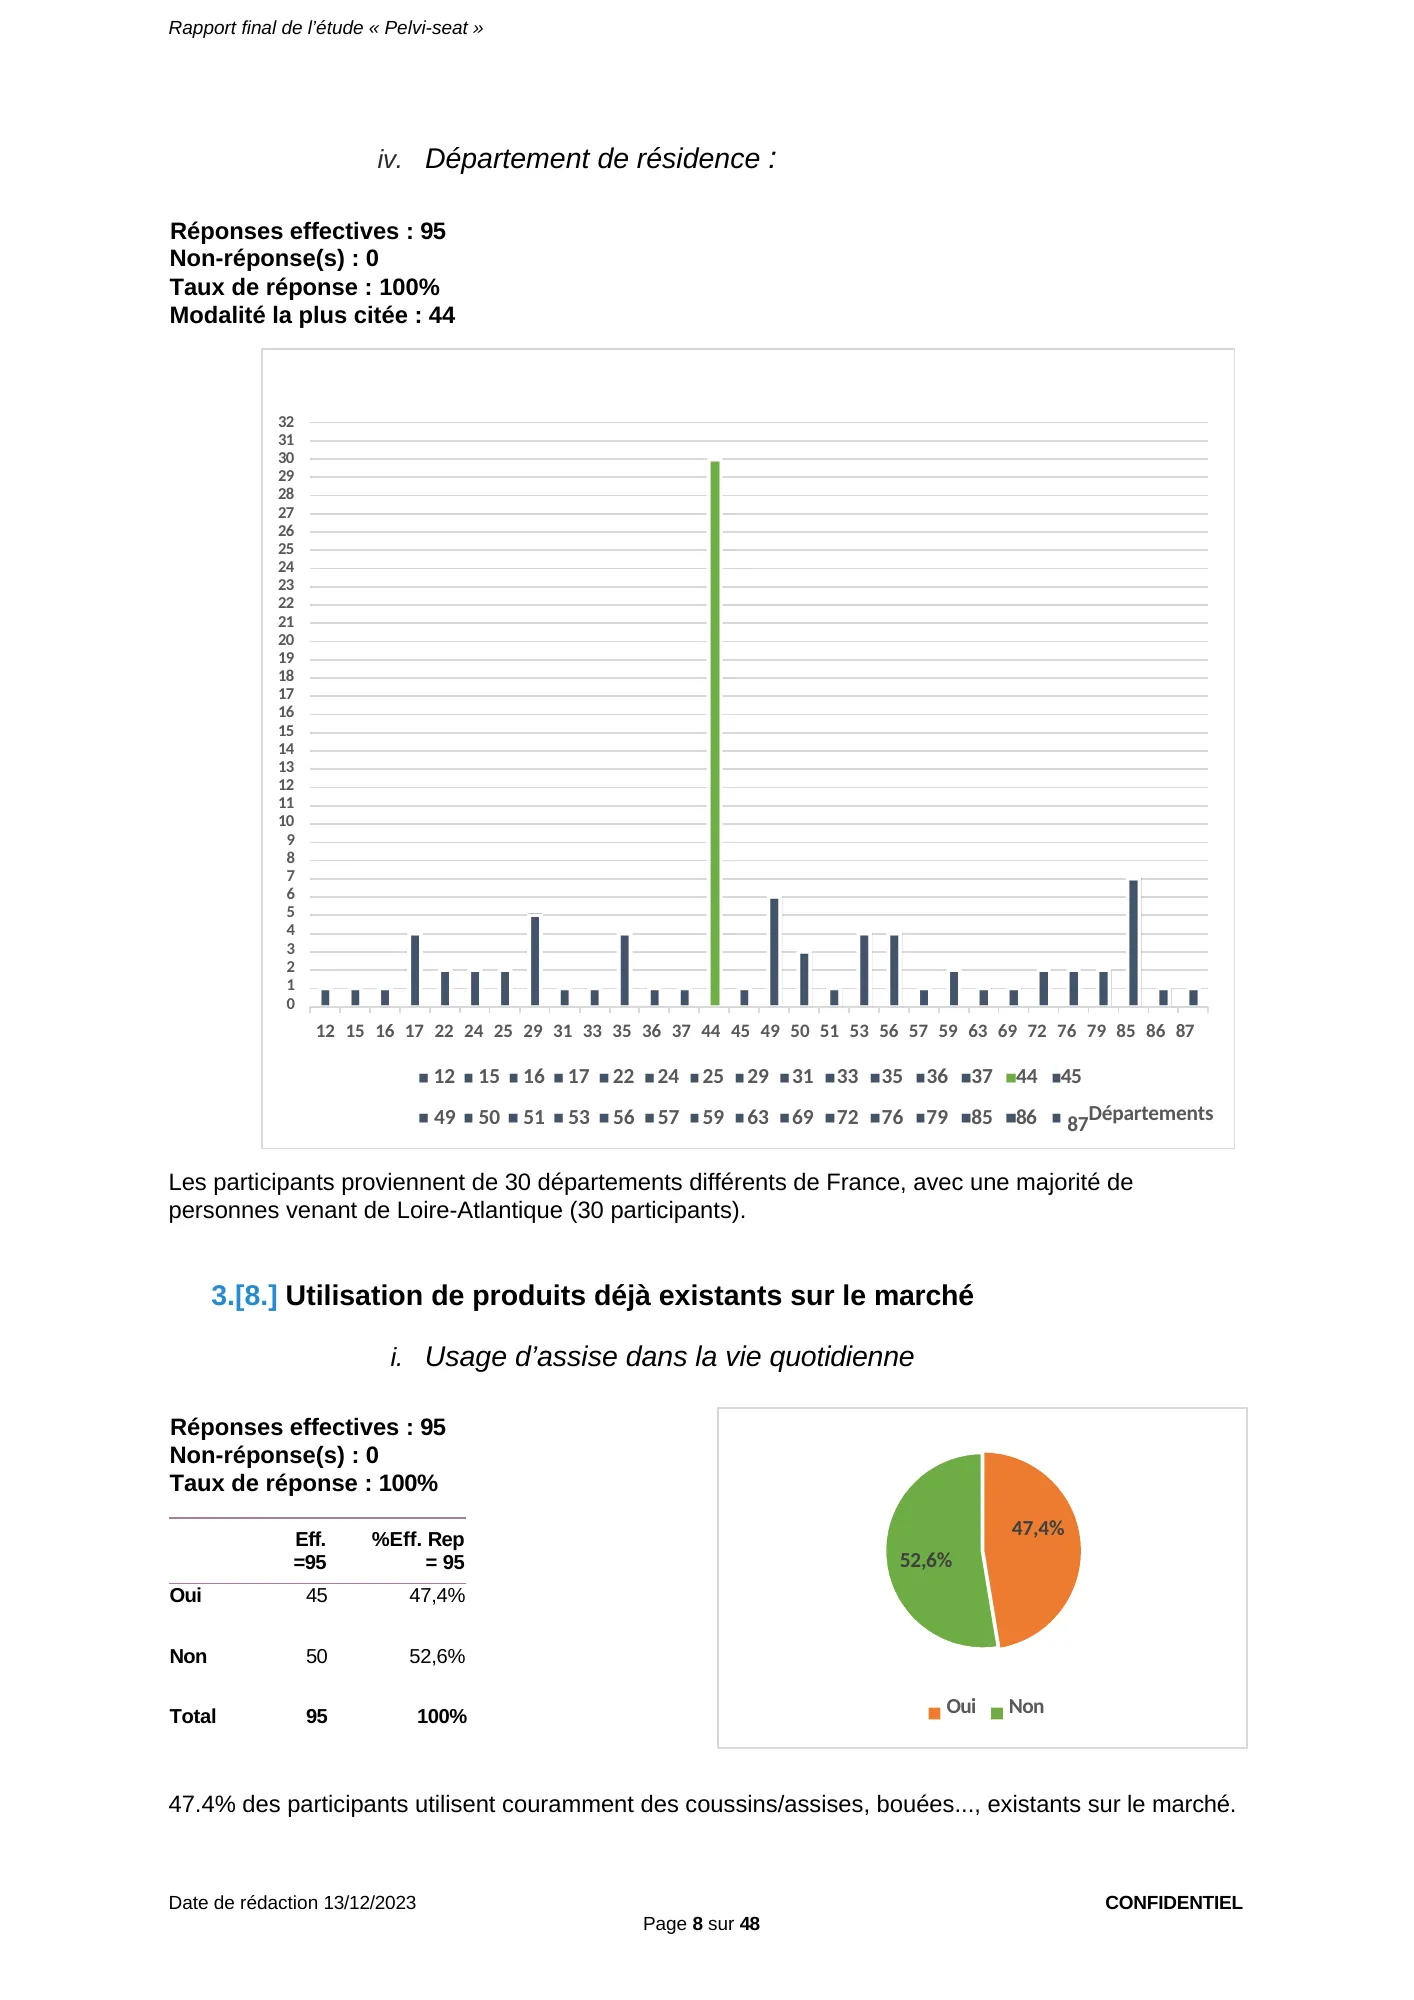
Participants come from 30 different French départements, most of them from Loire-Atlantique (30 participants).
3.[8.] Use of products already on the market
i. Use of seating in daily life
- Actual responses: 95
- No response(s): 0
- Response rate: 100%
| Eff. =95 | %Eff. Rep = 95 | |
|---|---|---|
| Yes | 45 | 47.4% |
| No | 50 | 52.6% |
| Total | 95 | 100% |
47.4% of participants regularly use cushions/seats, ring cushions, etc. available on the market.
View the original page (page 8 of the report, in French)
Page 8 — Geographic origin (95 patients, 30 French départements, 30 from Loire-Atlantique); 45 of 95 patients (47.4%) already use a cushion or ring cushion in daily life.
Report, page 9 of 48 — Price, models and satisfaction with existing seating (total sample)
ii. Prices and models
Of the 45 respondents who answered “Yes” to using a product in daily life, the price is given in 34 answers:
- Actual responses: 34
- No response(s): 11
- Response rate: 75.6%
- Mean: 85€
- Median: 42.5€
- Standard deviation: 92.81€
- Min – Max: 0€ – 300€
| Price (€) | Eff. Rep =34 | %Eff. Rep. =34 | %Eff.Tot =45 |
|---|---|---|---|
| 0 to 100 | 26 | 76.5% | 57.8% |
| 101 to 200 | 3 | 8.8% | 6.6% |
| 201 to 300 | 5 | 14.7% | 11.1% |
| Over 300 | 0 | 0% | 0% |
| No response | 11 | 24.4% | |
| Total | 45 | 100% | 100% |
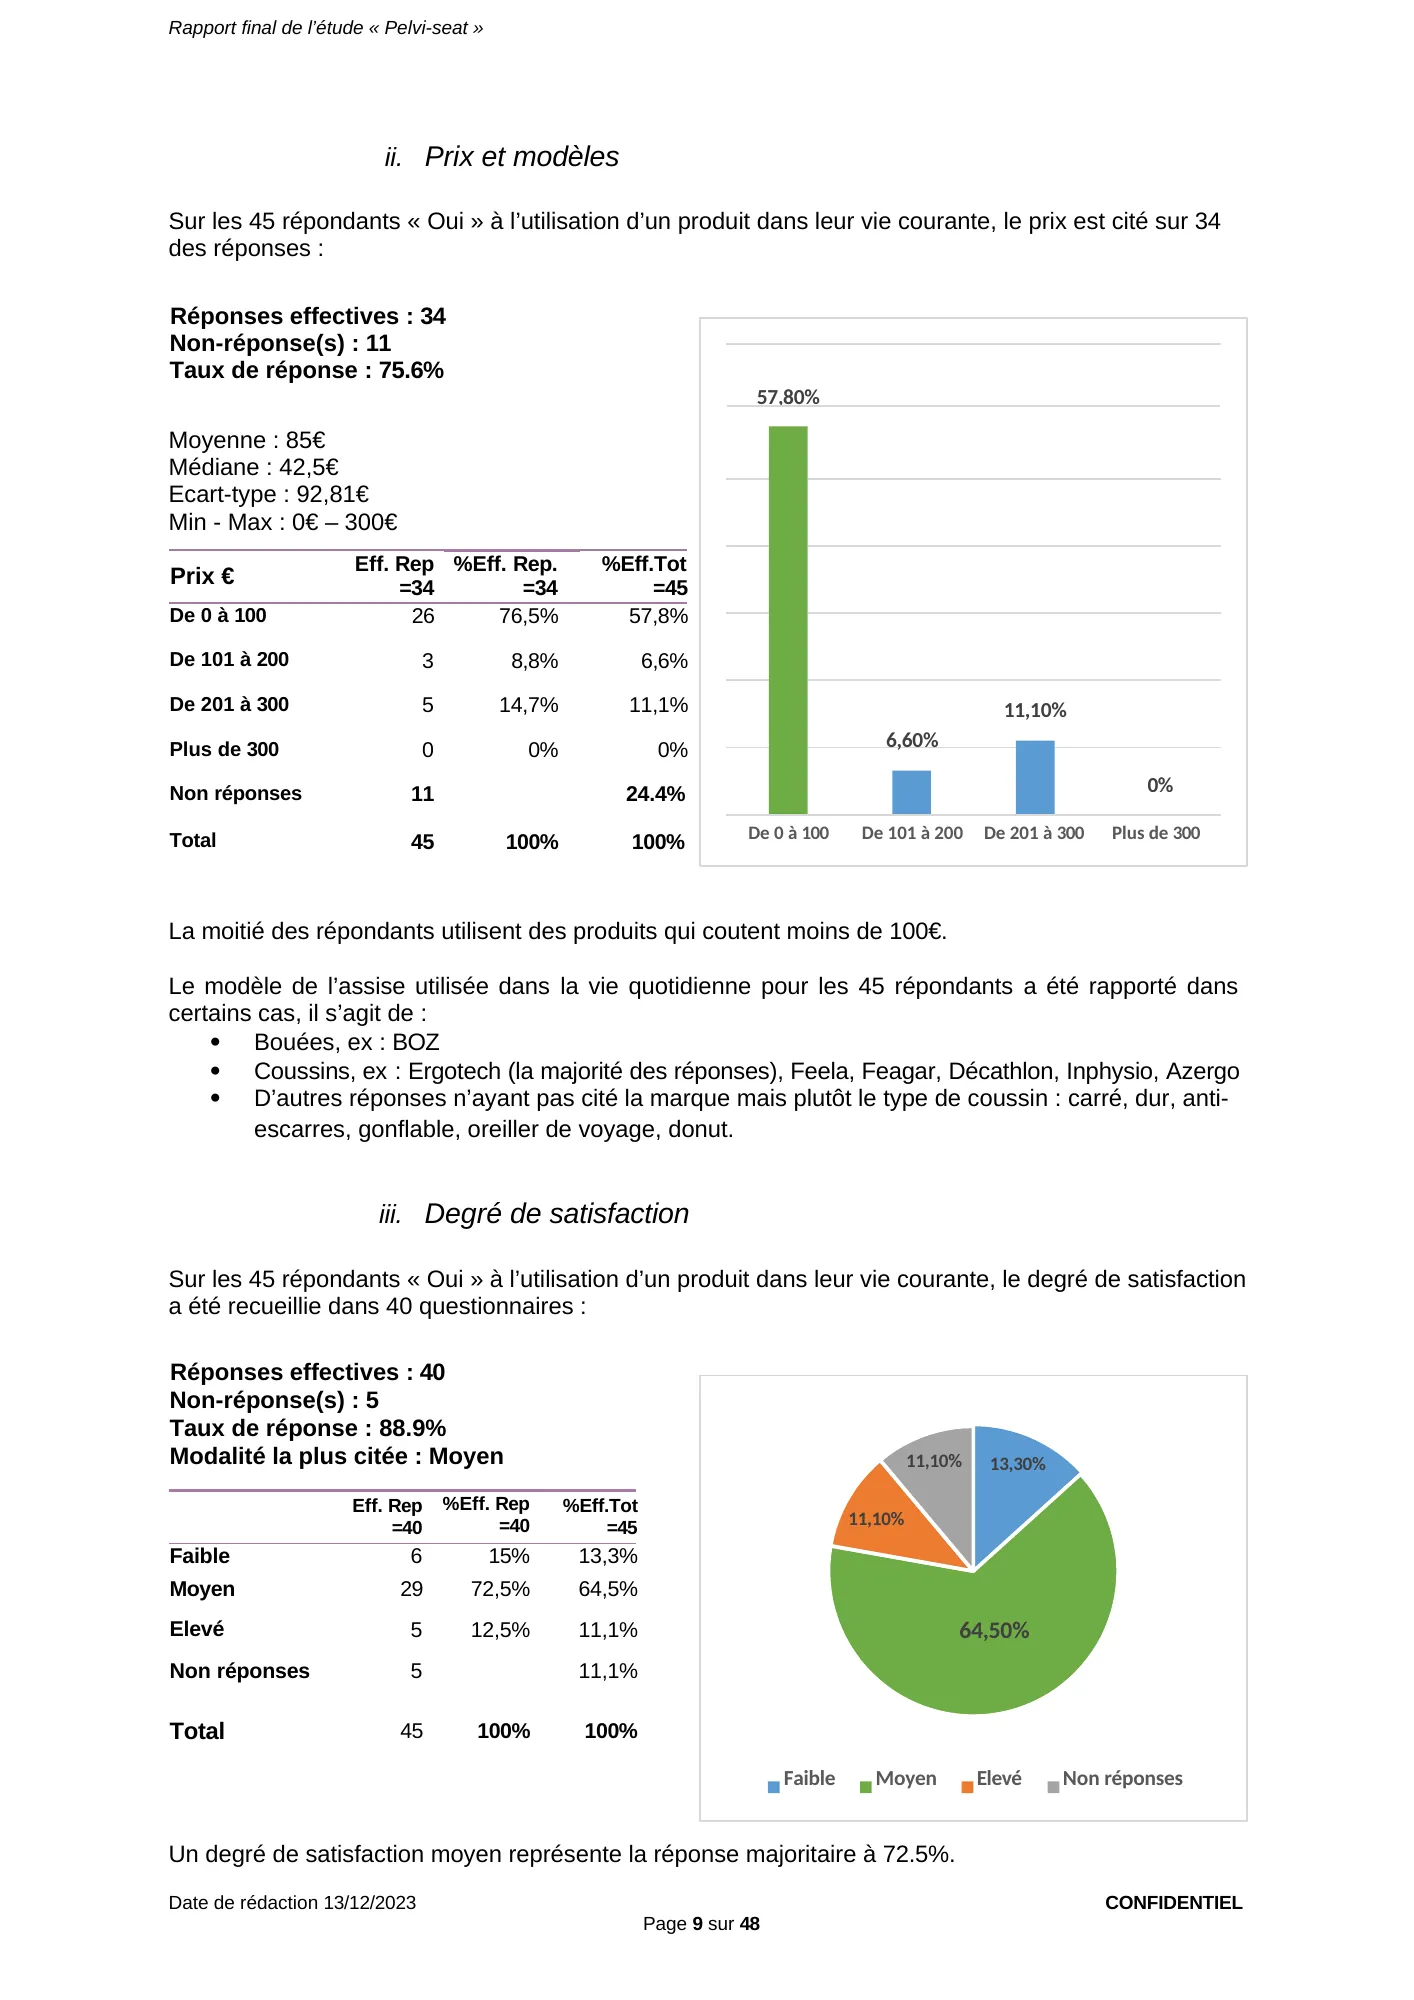
Half of the respondents use products costing less than €100.
The model of seat used in daily life by the 45 respondents was reported in some cases; these are:
- Ring cushions, e.g.: BOZ
- Cushions, e.g.: Ergotech (most answers), Feela, Feagar, Décathlon, Inphysio, Azergo
- Other answers did not name the brand but rather the type of cushion: square, hard, anti-pressure-sore, inflatable, travel pillow, donut.
iii. Level of satisfaction
Of the 45 respondents who answered “Yes” to using a product in daily life, the level of satisfaction was collected in 40 questionnaires:
- Actual responses: 40
- No response(s): 5
- Response rate: 88.9%
- Most frequent answer: Moyen
| Eff. Rep =40 | %Eff. Rep =40 | %Eff.Tot =45 | |
|---|---|---|---|
| Low | 6 | 15% | 13.3% |
| Average | 29 | 72.5% | 64.5% |
| High | 5 | 12.5% | 11.1% |
| No response | 5 | 11.1% | |
| Total | 45 | 100% | 100% |
An average level of satisfaction is the majority answer, at 72.5%.
View the original page (page 9 of the report, in French)
Page 9 — Seating already used (45 patients concerned): price given by 34, median price €42.50; “average” satisfaction for 29 of 40 respondents (72.5%).
Report, page 10 of 48 — Improvement criteria (total sample)
iv. Improvement criteria
Of the 45 respondents who answered “Yes” to using a product in daily life, the criteria they would like to see improved are reported in 39 questionnaires.
Note that the different categories of this variable are multiple-choice.
- Actual responses: 39
- No response: 6
- Response rate: 86.7%
- Most frequent answer: Pain
| Eff. Rep =39 | %Eff. Rep = 39 | % Eff. Tot =45 | |
|---|---|---|---|
| Comfort | 11 | 28.2% | 24.4% |
| Ergonomics | 19 | 48.7% | 42.2% |
| Pain | 29 | 74.4% | 64.4% |
| Postural support | 9 | 23.1% | 20% |
| Price | 8 | 20.5% | 17.8% |
| Discreetness of the device | 12 | 30.8% | 26.7% |
| Other: | 2 | 5.1% | 4.4% |
| No response | 6 | 13.3% | |
| Total | 45 |
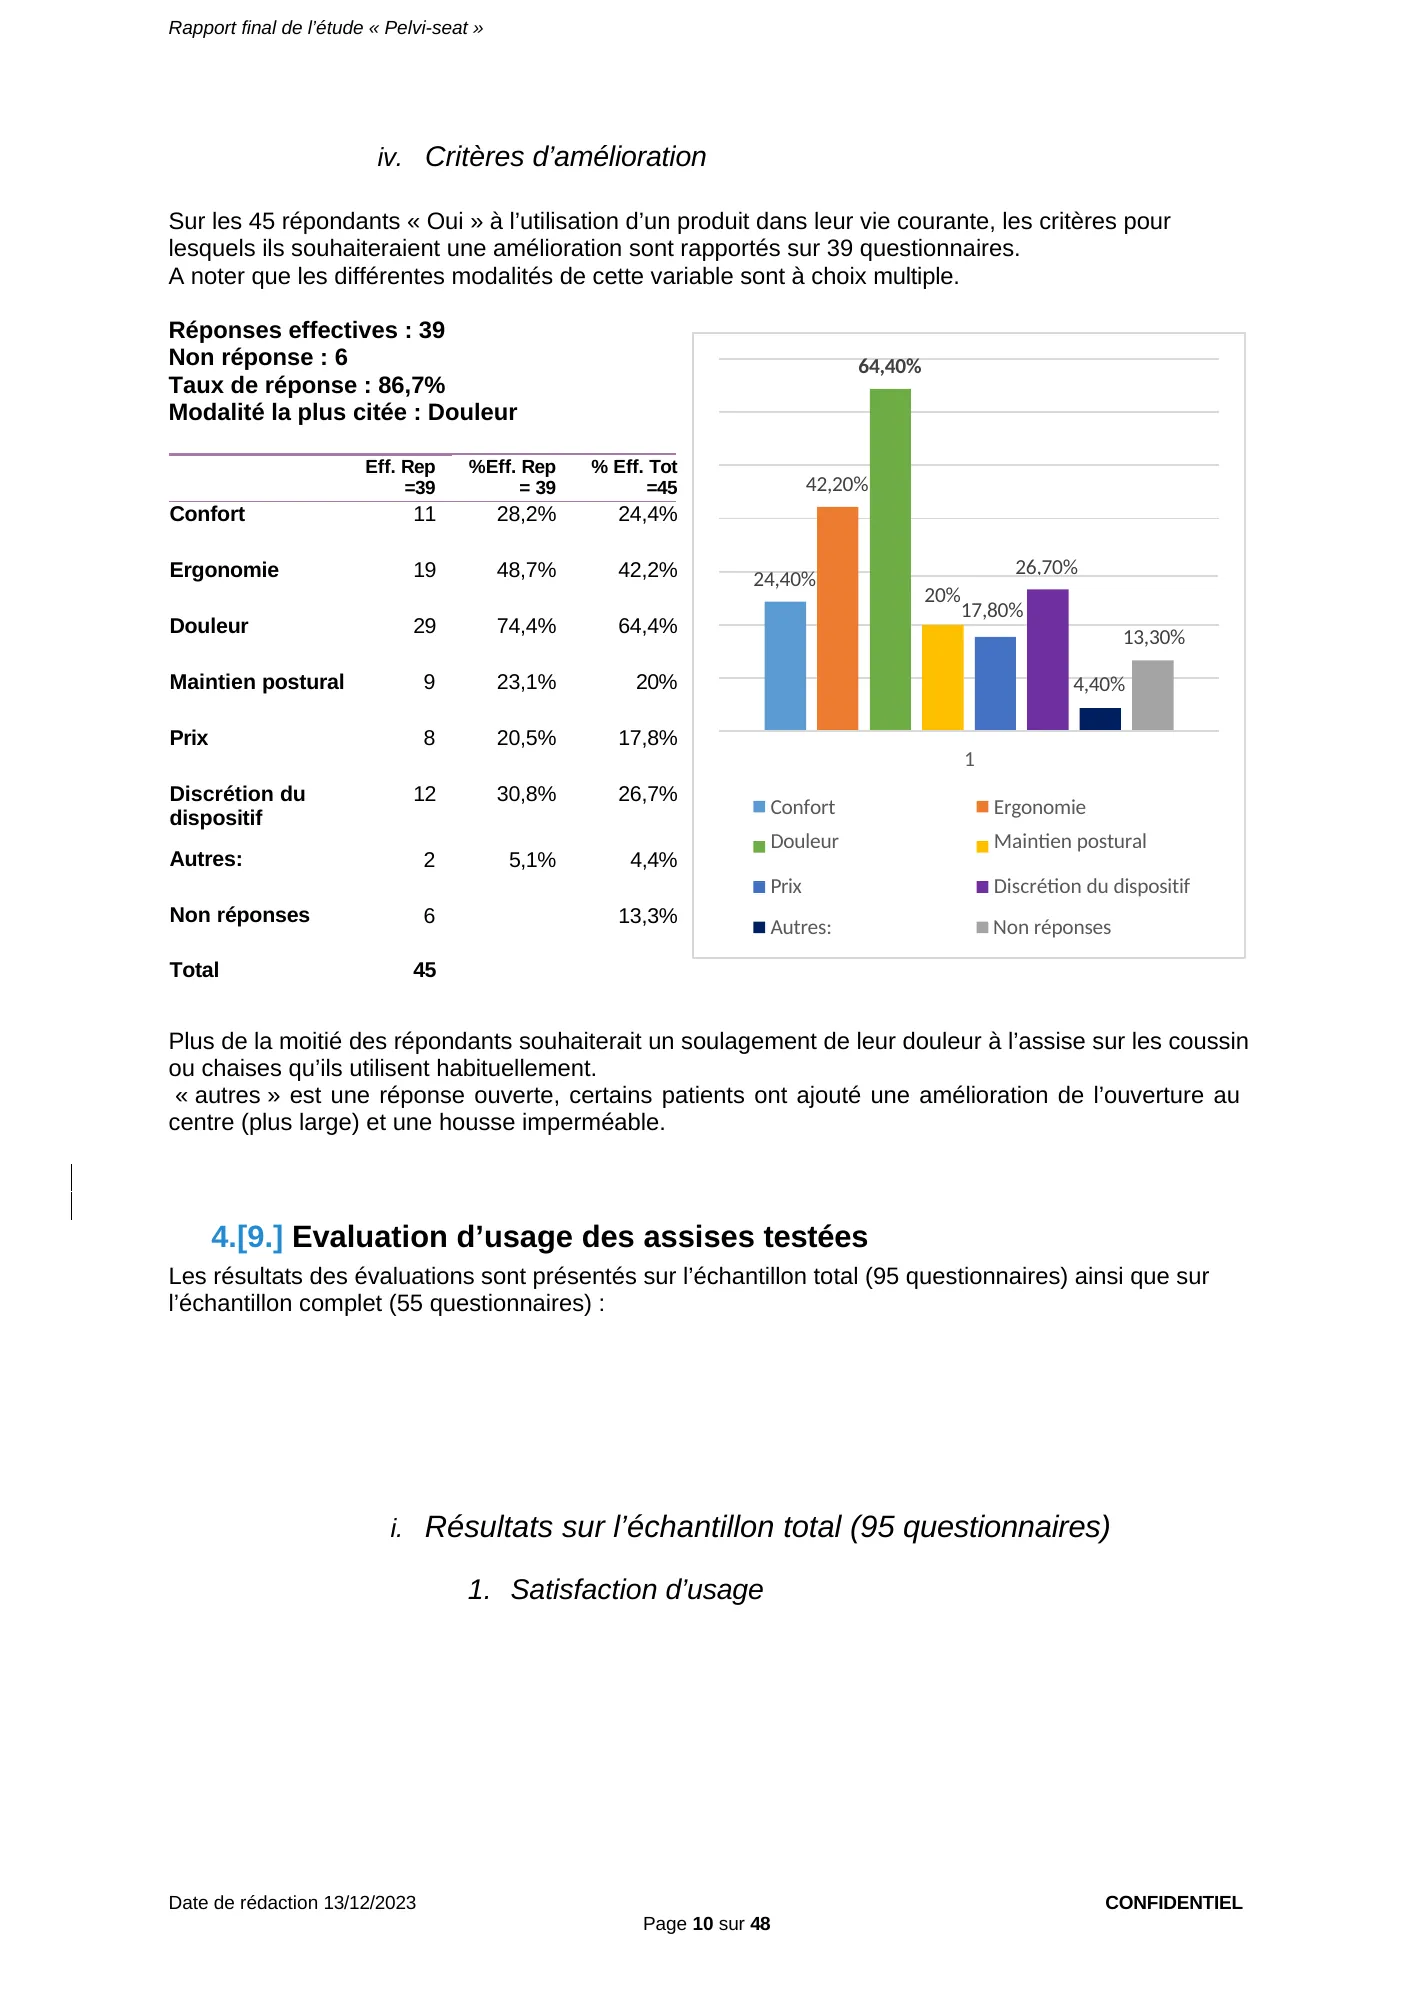
More than half of the respondents would like relief of their sitting pain on the cushions or chairs they usually use.
“Other” is an open answer; some patients added a wider central opening and a waterproof cover.
4.[9.] Evaluation of the use of the seats tested
The evaluation results are presented for the total sample (95 questionnaires) and for the complete sample (55 questionnaires):
i. Results for the total sample (95 questionnaires)
1. User satisfaction
View the original page (page 10 of the report, in French)
Page 10 — Expectations of patients already using a seat: pain relief cited by 29 of 39 respondents (74.4%), the most expected improvement.
Report, page 11 of 48 — User satisfaction, total sample (95 questionnaires)
Chair 1: Hard chair
Of the 95 questionnaires collected, 68 answers on user satisfaction with chair 1 (hard chair) were collected:
- Actual responses: 68
- No response: 27
- Response rate: 71.6%
- Most frequent answer excluding non-respondents: No response
| Chair 1 | Eff.Rep =95 | % Eff. Rep =68 | %Eff. Tot =95 |
|---|---|---|---|
| Not satisfied | 25 | 36.7% | 26.3% |
| Slightly satisfied | 18 | 26.5% | 19% |
| Indifferent | 8 | 11.8% | 8.4% |
| Satisfied | 14 | 20.6% | 14.7% |
| Very satisfied | 3 | 4.4% | 3.2% |
| No response | 27 | 28.4% | |
| Total | 95 | 100% | 100% |
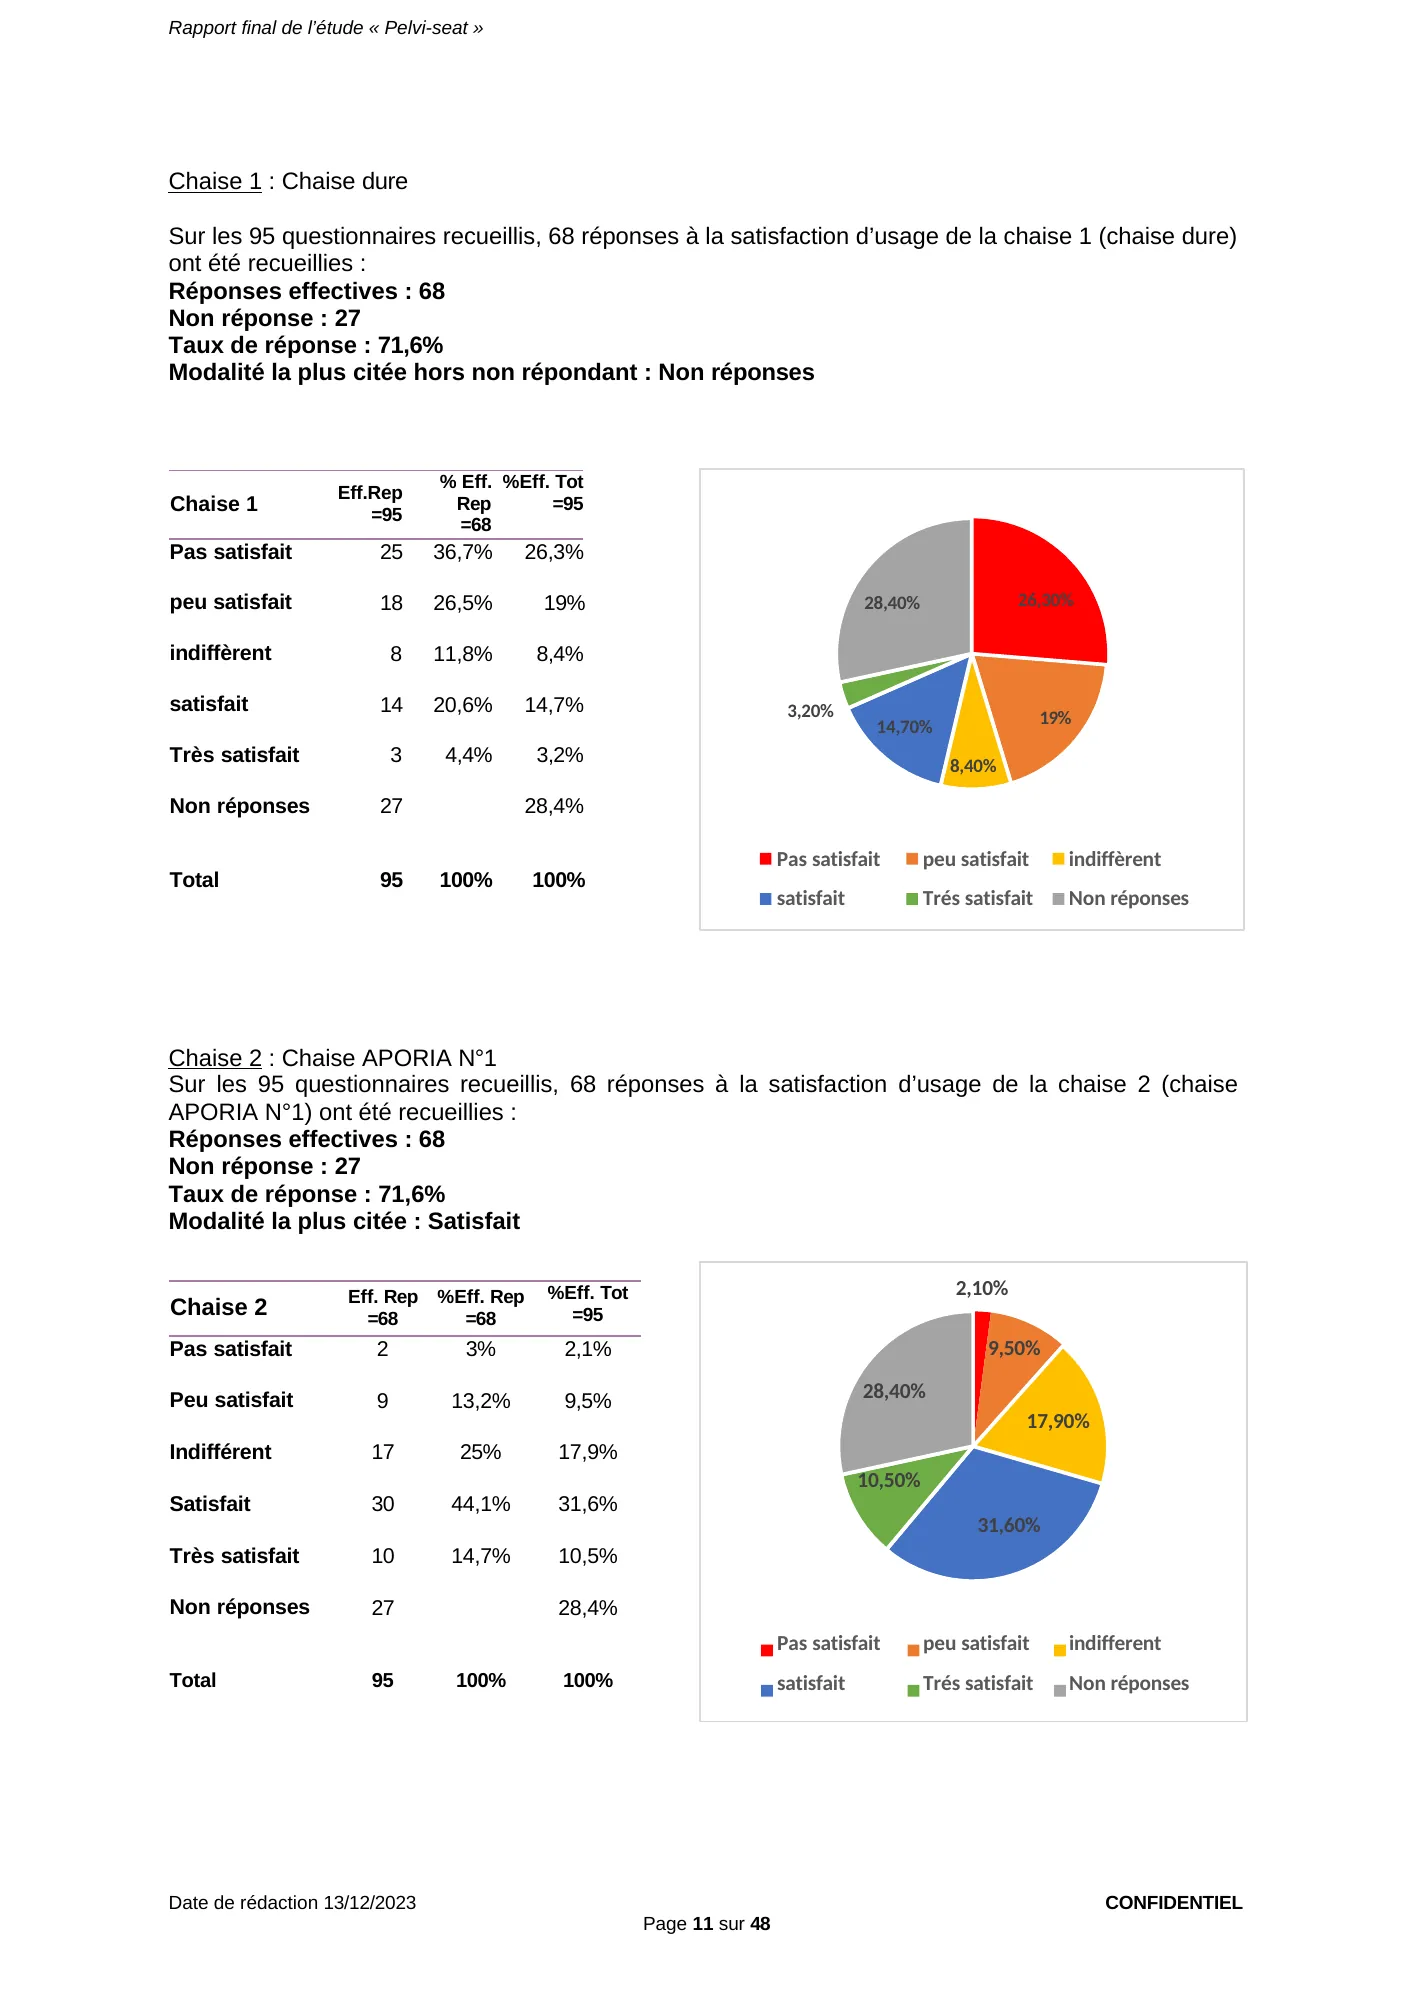
Chair 2: APORIA N°1 chair
Of the 95 questionnaires collected, 68 answers on user satisfaction with chair 2 (APORIA N°1 chair) were collected:
- Actual responses: 68
- No response: 27
- Response rate: 71.6%
- Most frequent answer: Satisfied
| Chair 2 | Eff. Rep =68 | %Eff. Rep =68 | %Eff. Tot =95 |
|---|---|---|---|
| Not satisfied | 2 | 3% | 2.1% |
| Slightly satisfied | 9 | 13.2% | 9.5% |
| Indifferent | 17 | 25% | 17.9% |
| Satisfied | 30 | 44.1% | 31.6% |
| Very satisfied | 10 | 14.7% | 10.5% |
| No response | 27 | 28.4% | |
| Total | 95 | 100% | 100% |
View the original page (page 11 of the report, in French)
Page 11 — User satisfaction, total sample: hard chair, 25 “not satisfied” of 68 respondents (36.7%); Aporia® N°1, 40 satisfied or very satisfied of 68 (58.8%).
Report, page 12 of 48 — User satisfaction, total sample (95 questionnaires)
Chair 3: Padded chair
Of the 95 questionnaires collected, 67 answers on user satisfaction with chair 3 (padded chair) were collected:
- Actual responses: 67
- No response: 28
- Response rate: 70.5%
- Most frequent answer: Slightly satisfied and No response
| Chair 3 | Eff. Rep =67 | %Eff. Rep =67 | %Eff. Tot =95) |
|---|---|---|---|
| Not satisfied | 6 | 9% | 6.3% |
| Slightly satisfied | 28 | 41.8% | 29.5% |
| Indifferent | 13 | 19.4% | 13.7% |
| Satisfied | 13 | 19.4% | 13.7% |
| Very satisfied | 7 | 10.4% | 7.3% |
| No response | 28 | 29.5% | |
| Total | 95 | 100% | 100% |
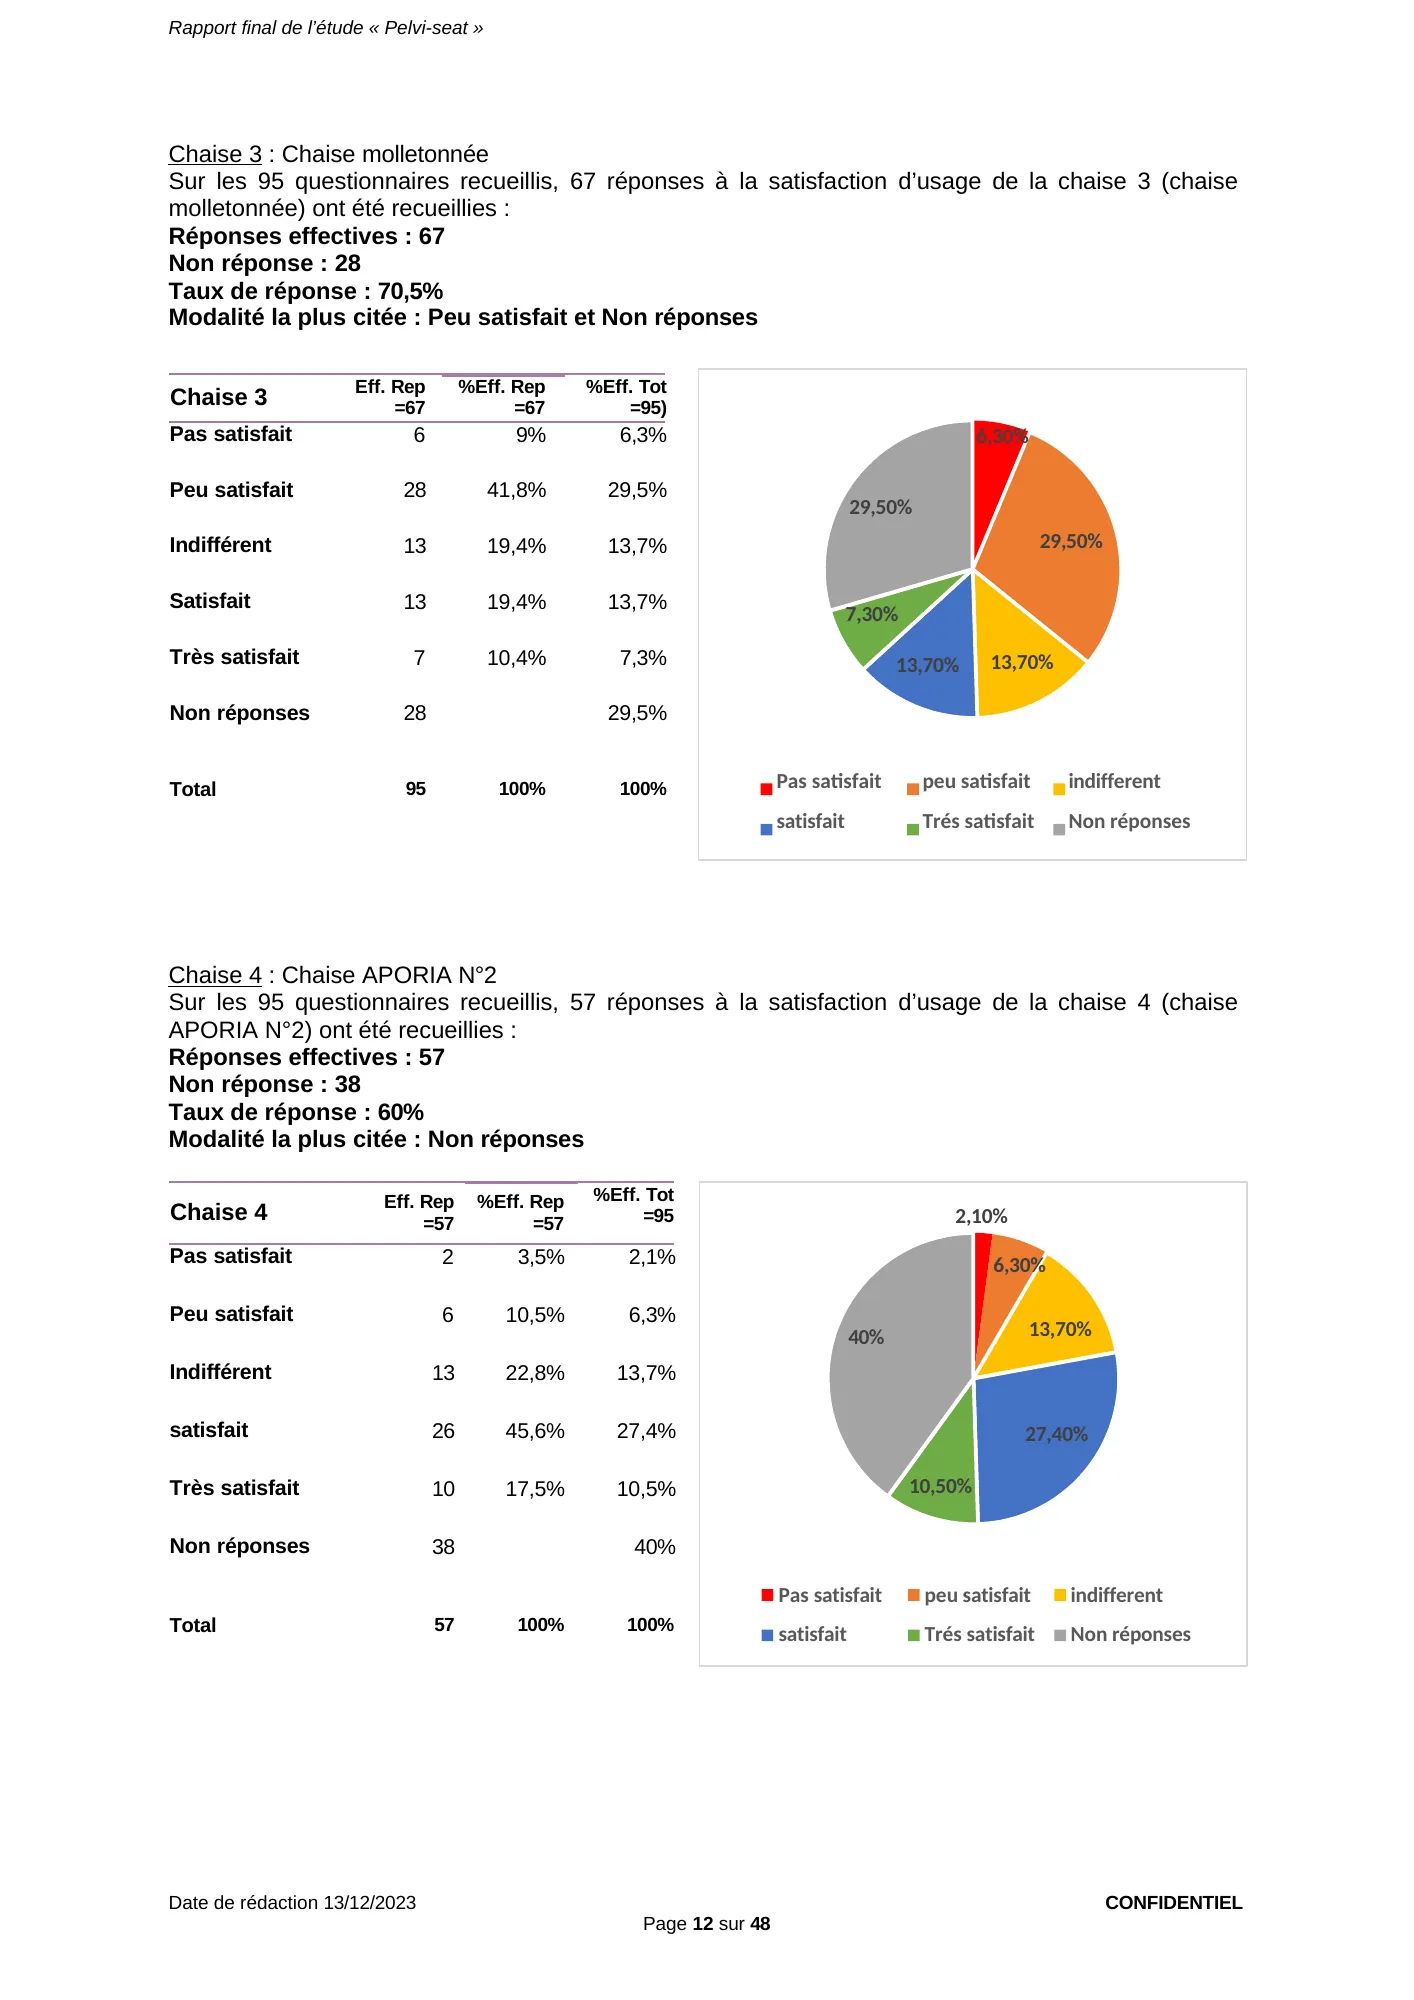
Chair 4: APORIA N°2 chair
Of the 95 questionnaires collected, 57 answers on user satisfaction with chair 4 (APORIA N°2 chair) were collected:
- Actual responses: 57
- No response: 38
- Response rate: 60%
- Most frequent answer: No response
| Chair 4 | Eff. Rep =57 | %Eff. Rep =57 | %Eff. Tot =95 |
|---|---|---|---|
| Not satisfied | 2 | 3.5% | 2.1% |
| Slightly satisfied | 6 | 10.5% | 6.3% |
| Indifferent | 13 | 22.8% | 13.7% |
| Satisfied | 26 | 45.6% | 27.4% |
| Very satisfied | 10 | 17.5% | 10.5% |
| No response | 38 | 40% | |
| Total | 57 | 100% | 100% |
View the original page (page 12 of the report, in French)
Page 12 — User satisfaction, total sample: padded chair, 28 “slightly satisfied” of 67 (41.8%); Aporia® N°2, 36 satisfied or very satisfied of 57 respondents (63.1%).
Report, page 13 of 48 — Summary of user satisfaction, total sample (95 questionnaires)
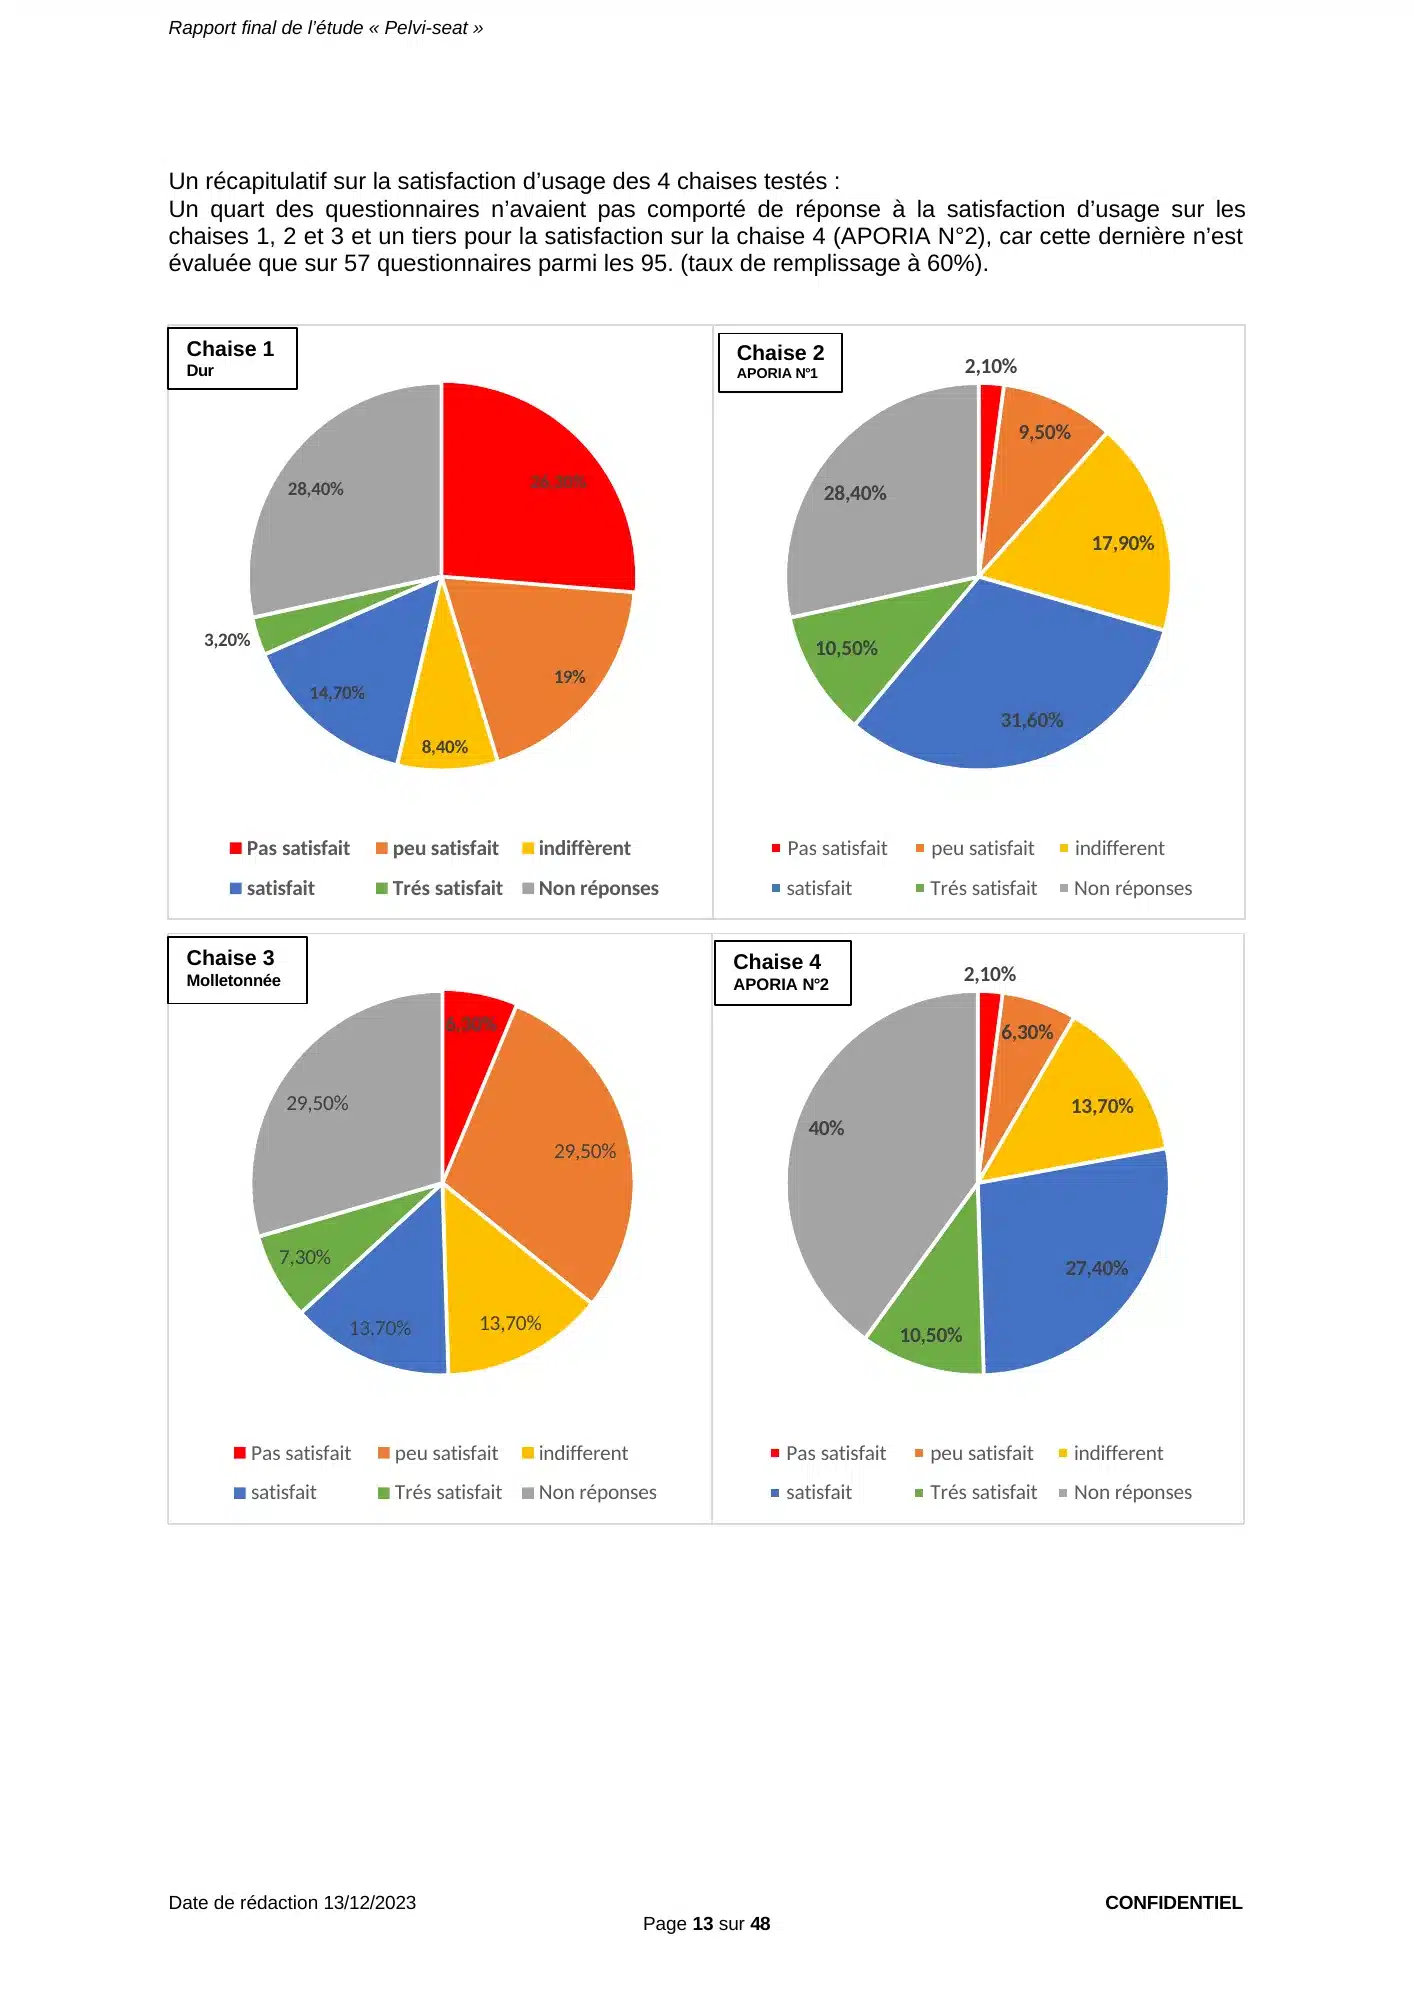
Summary of user satisfaction for the 4 chairs tested:
A quarter of the questionnaires contained no answer on user satisfaction for chairs 1, 2 and 3, and a third for chair 4 (APORIA N°2), because the latter was evaluated in only 57 of the 95 questionnaires (completion rate 60%).
View the original page (page 13 of the report, in French)
Page 13 — Summary of user satisfaction for the 4 seats tested (total sample of 95 questionnaires).
Report, page 14 of 48 — Pain while seated, total sample (95 questionnaires)
2. Pain while seated
Chair 1: Hard chair
Of the 95 questionnaires collected, 90 answers on the presence or absence of pain after sitting for 2 minutes on the hard chair were collected:
- Actual responses: 90
- No response: 5
- Response rate: 94.7%
- Most frequent answer: Pain, but able to remain seated
| Chair 1 | Eff. Rep =90 | %Eff. Rep =90 | %Eff. Tot =95 |
|---|---|---|---|
| No pain | 17 | 18.9% | 17.9% |
| Pain, but able to remain seated | 45 | 50% | 47.3% |
| Pain forcing the patient to get up | 28 | 31.1% | 29.5% |
| No response | 5 | 5.3% | |
| Total | 95 | 100% | 100% |
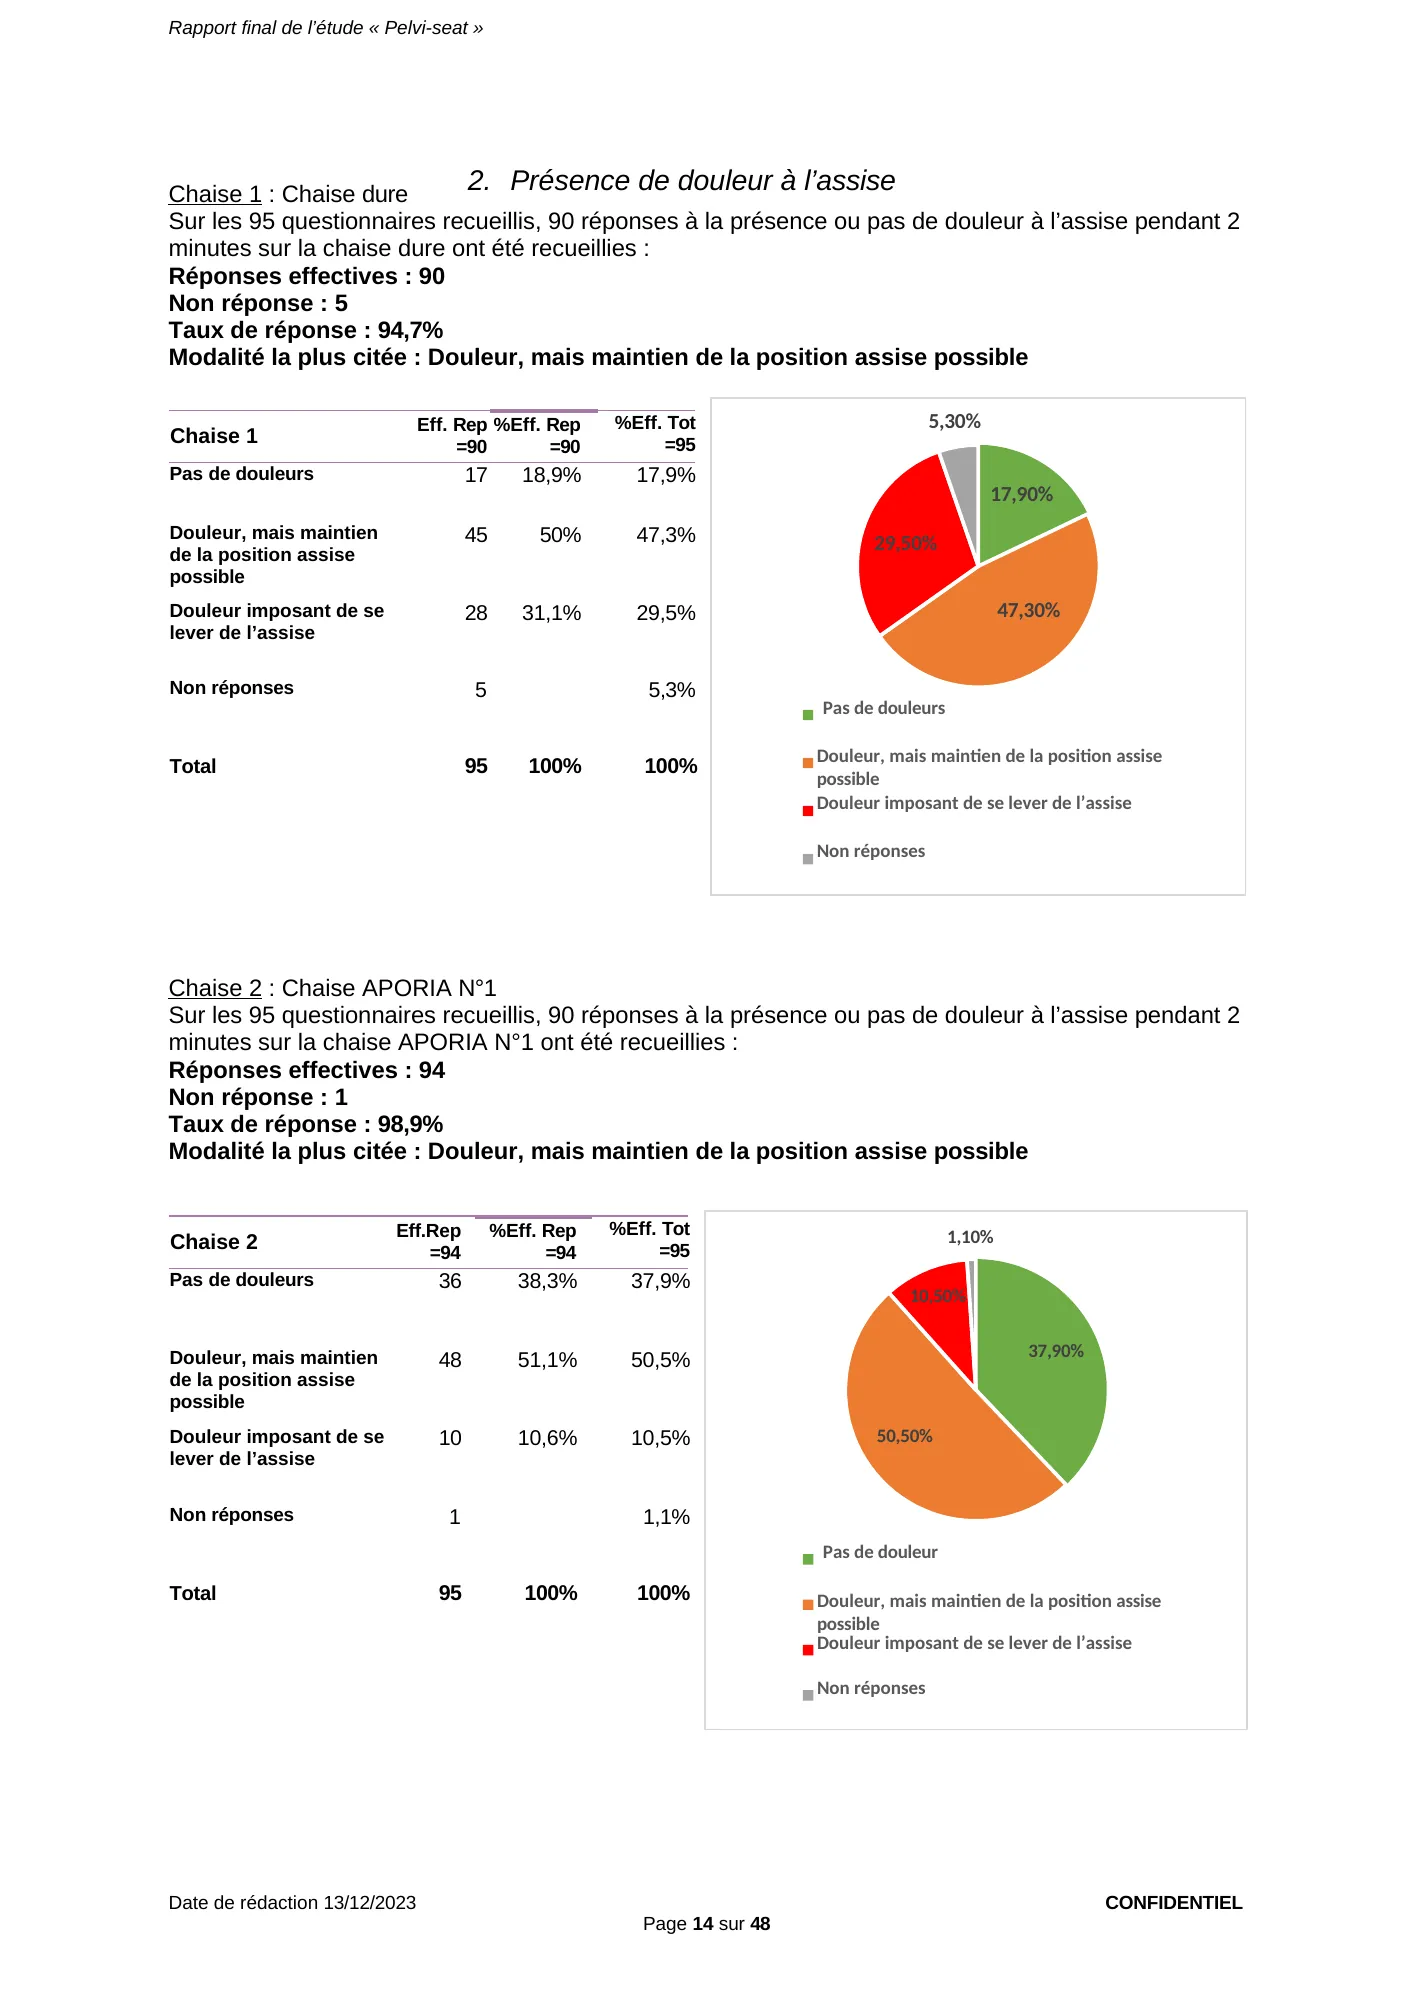
Chair 2: APORIA N°1 chair
Of the 95 questionnaires collected, 90 answers on the presence or absence of pain after sitting for 2 minutes on the APORIA N°1 chair were collected:
- Actual responses: 94
- No response: 1
- Response rate: 98.9%
- Most frequent answer: Pain, but able to remain seated
| Chair 2 | Eff.Rep =94 | %Eff. Rep =94 | %Eff. Tot =95 |
|---|---|---|---|
| No pain | 36 | 38.3% | 37.9% |
| Pain, but able to remain seated | 48 | 51.1% | 50.5% |
| Pain forcing the patient to get up | 10 | 10.6% | 10.5% |
| No response | 1 | 1.1% | |
| Total | 95 | 100% | 100% |
View the original page (page 14 of the report, in French)
Page 14 — Pain after 2 minutes seated, total sample: 28 of 90 patients have to get up from the hard chair (31.1%), versus 10 of 94 on the Aporia® N°1 (10.6%).
Report, page 15 of 48 — Pain while seated, total sample (95 questionnaires)
Chair 3: Padded chair
Of the 95 questionnaires collected, 91 answers on the presence or absence of pain after sitting for 2 minutes on the APORIA N°3 chair were collected:
- Actual responses: 91
- No response: 4
- Response rate: 95.8%
- Most frequent answer: Pain, but able to remain seated
| Chair 3 | Eff. Rep =91 | %Eff. Rep =91 | %Eff. Tot =95 |
|---|---|---|---|
| No pain | 19 | 20.9% | 20% |
| Pain, but able to remain seated | 50 | 54.9% | 52.6% |
| Pain forcing the patient to get up | 22 | 24.2% | 23.2% |
| No response | 4 | 4.2% | |
| Total | 95 | 100% | 100% |
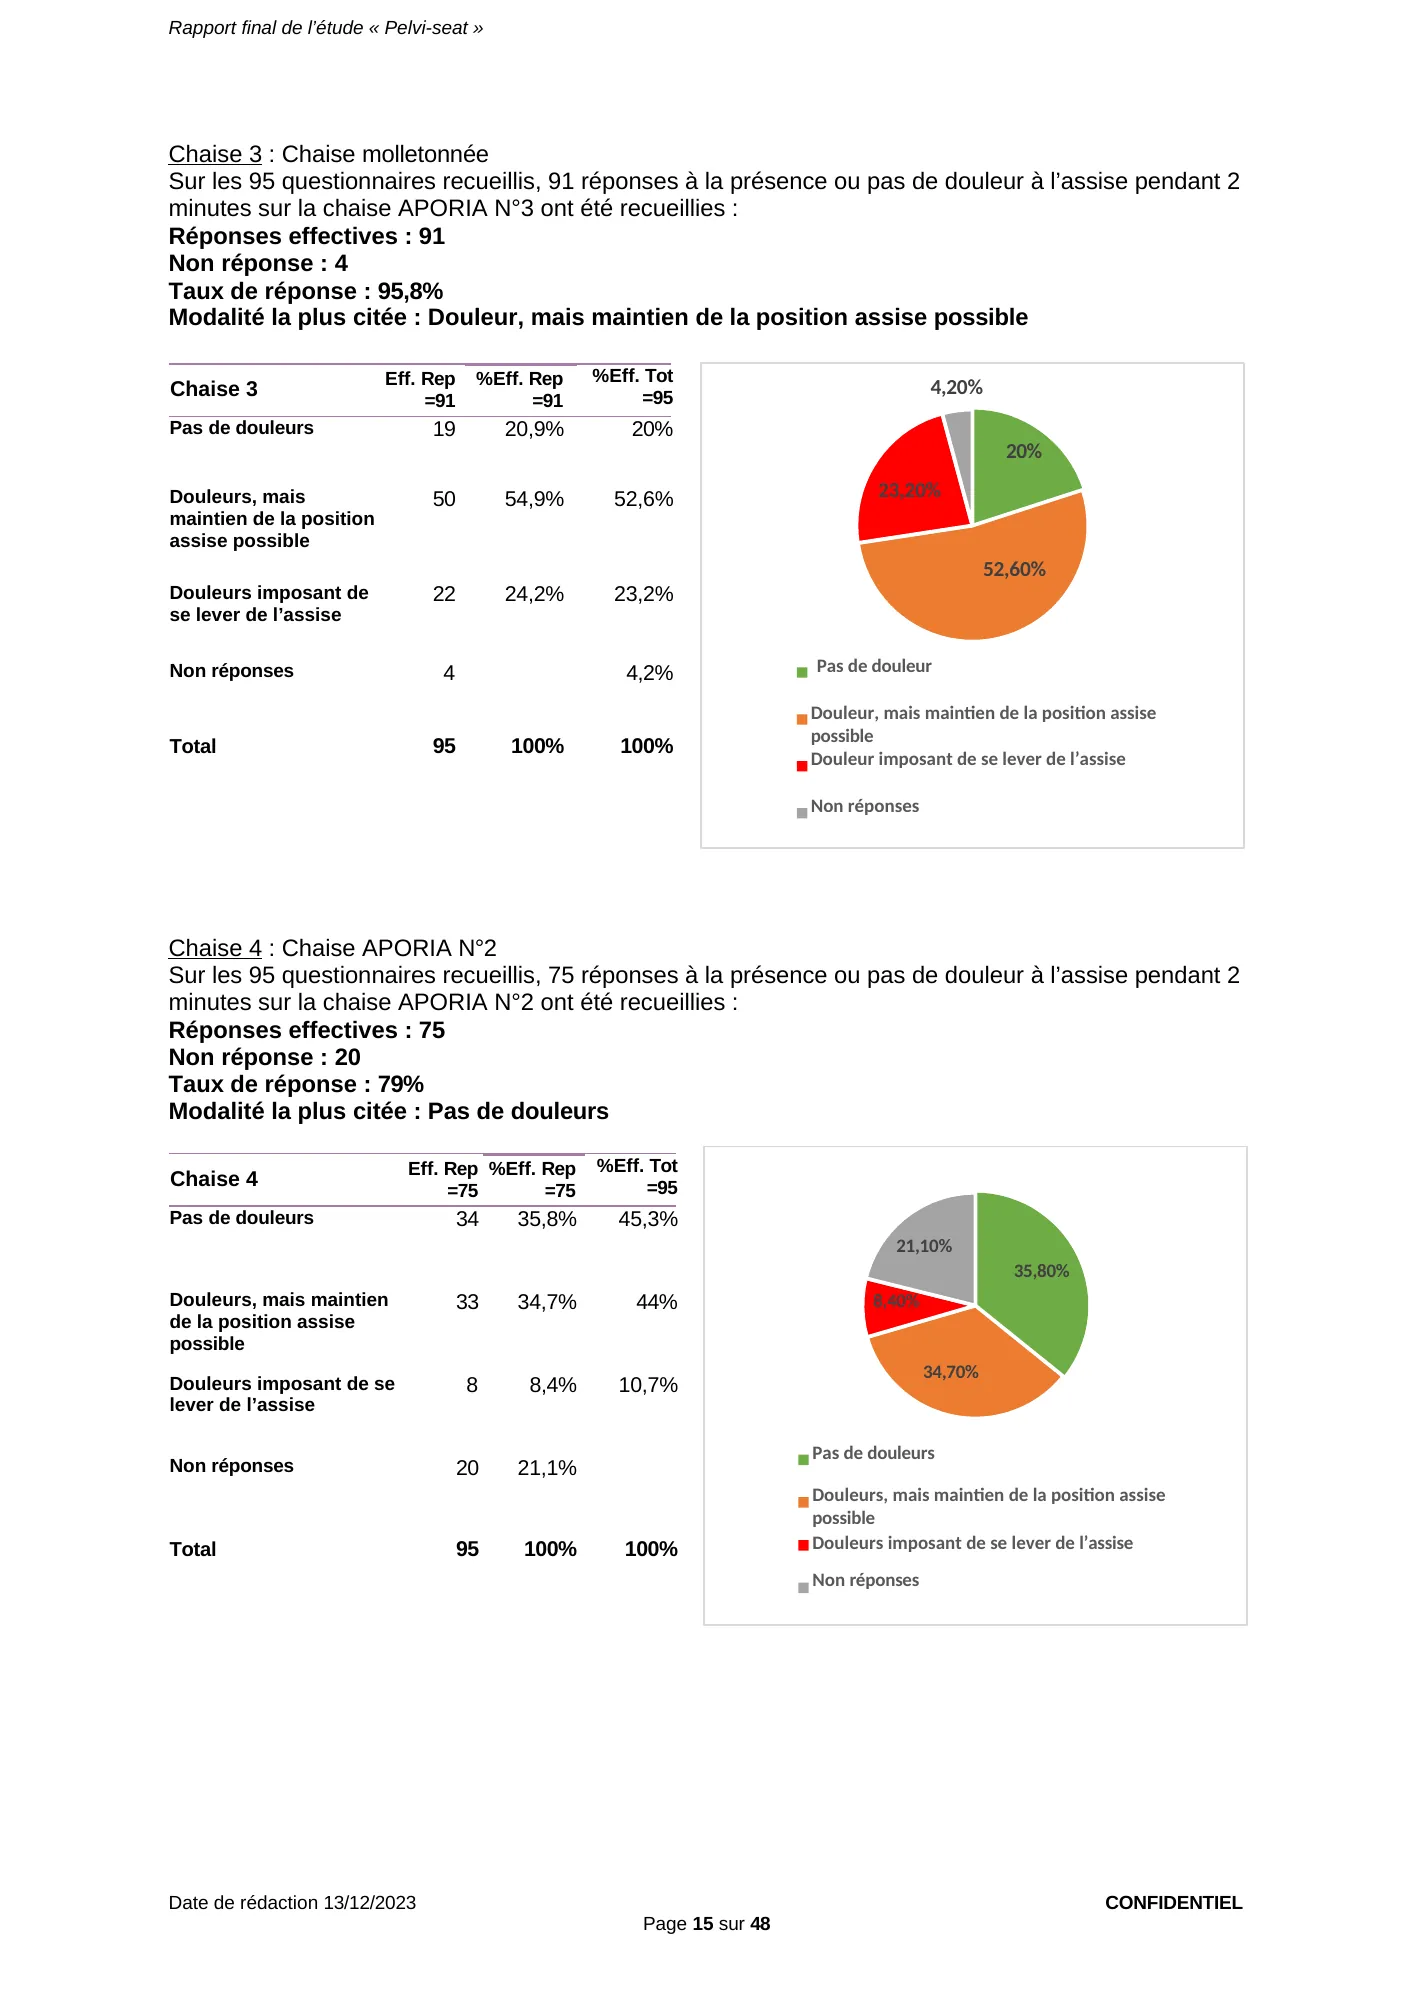
Chair 4: APORIA N°2 chair
Of the 95 questionnaires collected, 75 answers on the presence or absence of pain after sitting for 2 minutes on the APORIA N°2 chair were collected:
- Actual responses: 75
- No response: 20
- Response rate: 79%
- Most frequent answer: No pain
| Chair 4 | Eff. Rep =75 | %Eff. Rep =75 | %Eff. Tot =95 |
|---|---|---|---|
| No pain | 34 | 35.8% | 45.3% |
| Pain, but able to remain seated | 33 | 34.7% | 44% |
| Pain forcing the patient to get up | 8 | 8.4% | 10.7% |
| No response | 20 | 21.1% | |
| Total | 95 | 100% | 100% |
View the original page (page 15 of the report, in French)
Page 15 — Pain after 2 minutes seated, total sample: padded chair, 22 of 91 patients have to get up (24.2%); Aporia® N°2, 34 of 75 respondents without pain.
Report, page 16 of 48 — Summary of pain while seated, total sample (95 questionnaires)
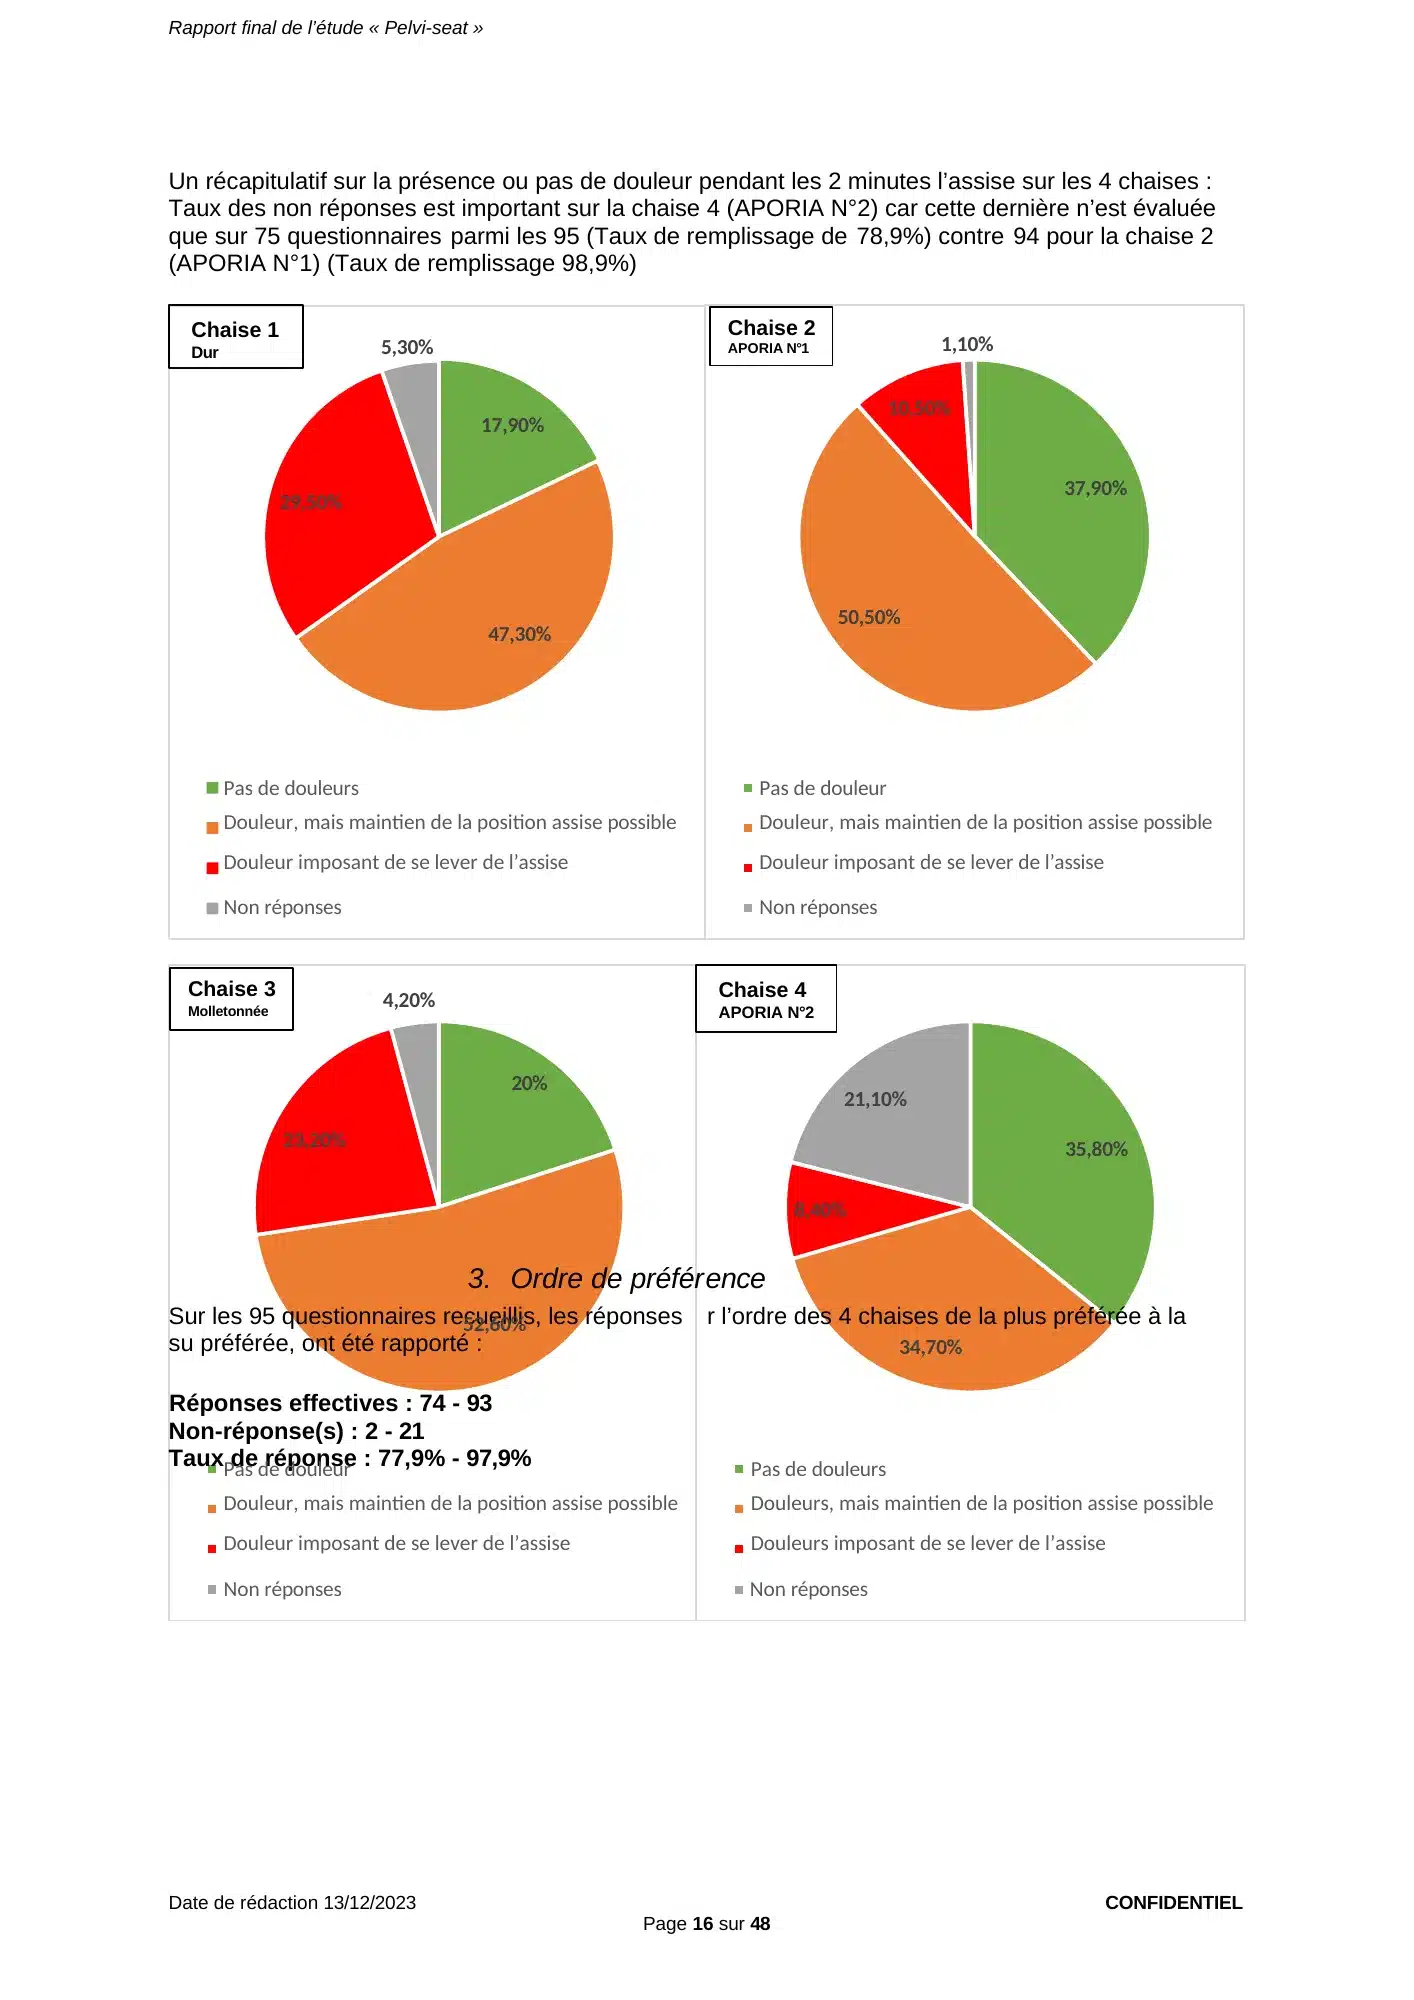
Summary of the presence or absence of pain during the 2 minutes seated on the 4 chairs:
The non-response rate is high for chair 4 (APORIA N°2) because it was evaluated in only 75 of the 95 questionnaires (completion rate 78.9%), versus 94 for chair 2 (APORIA N°1) (completion rate 98.9%)
Chair 3 — Padded
Chair 4 — APORIA N°2
3. Order of preference
Of the 95 questionnaires collected, the answers […] the order of the 4 chairs from most preferred to […] preferred were reported:
- Actual responses: 74 – 93
- No response(s): 2 – 21
- Response rate: 77.9% – 97.9%
Transcription note: in the original report, this paragraph overlaps the charts and part of the text is hidden; illegible passages are marked […].
View the original page (page 16 of the report, in French)
Page 16 — Summary of pain while seated on the 4 seats (total sample).
Report, page 17 of 48 — Order of preference, total sample (95 questionnaires)
4. Order of preference
Patients were asked to rank the 4 chairs by preference, from most preferred to least preferred. The following table shows the answers collected:
- Actual responses: Between 74 – 93
- No response: Between 21 – 2
- Response rate: Between 83.2% – 97.9%
| Chair | 1st most preferred chair Eff. Rep = 93 | %Eff. Rep = 93 | %Eff. Tot =95 | 2nd most preferred chair Eff. Rep= 93 | %Eff. Rep = 93 | %Eff. Tot = 95 |
|---|---|---|---|---|---|---|
| N°1 (hard) | 10 | 10.8% | 10.5% | 8 | 8.6% | 8.5% |
| N°2 (APORIA N°1) | 39 | 41.9% | 41% | 34 | 36.5% | 35.8% |
| N°3 (padded) | 13 | 14% | 13.7% | 18 | 19.4% | 18.9% |
| N°4 (APORIA N°2) | 31 | 33.3% | 32.7% | 33 | 35.5% | 34.7% |
| No response | 2 | 2.1% | 2 | 2.1% | ||
| Total | 95 | 100% | 100% | 95 | 100% | 100% |
| Chair | 3rd most preferred chair Eff. Rep= 89 | %Eff. Rep = 89 | %Eff. Tot = 95 | Least preferred chair Eff. Rep= 74 | %Eff. Rep = 74 | %Eff. Tot = 95 |
|---|---|---|---|---|---|---|
| N°1 (hard) | 19 | 21.3% | 20% | 52 | 70.3% | 54.7% |
| N°2 (APORIA N°1) | 15 | 16.9% | 15.8% | 5 | 6.8% | 5.3% |
| N°3 (padded) | 46 | 51.7% | 48.4% | 13 | 17.5% | 13.7% |
| N°4 (APORIA N°2) | 9 | 10.1% | 9.5% | 4 | 5.4% | 4.2% |
| No response | 6 | 6.3% | 21 | 22.1% | ||
| Total | 95 | 100% | 100% | 95 | 100% | 100% |
View the original page (page 17 of the report, in French)
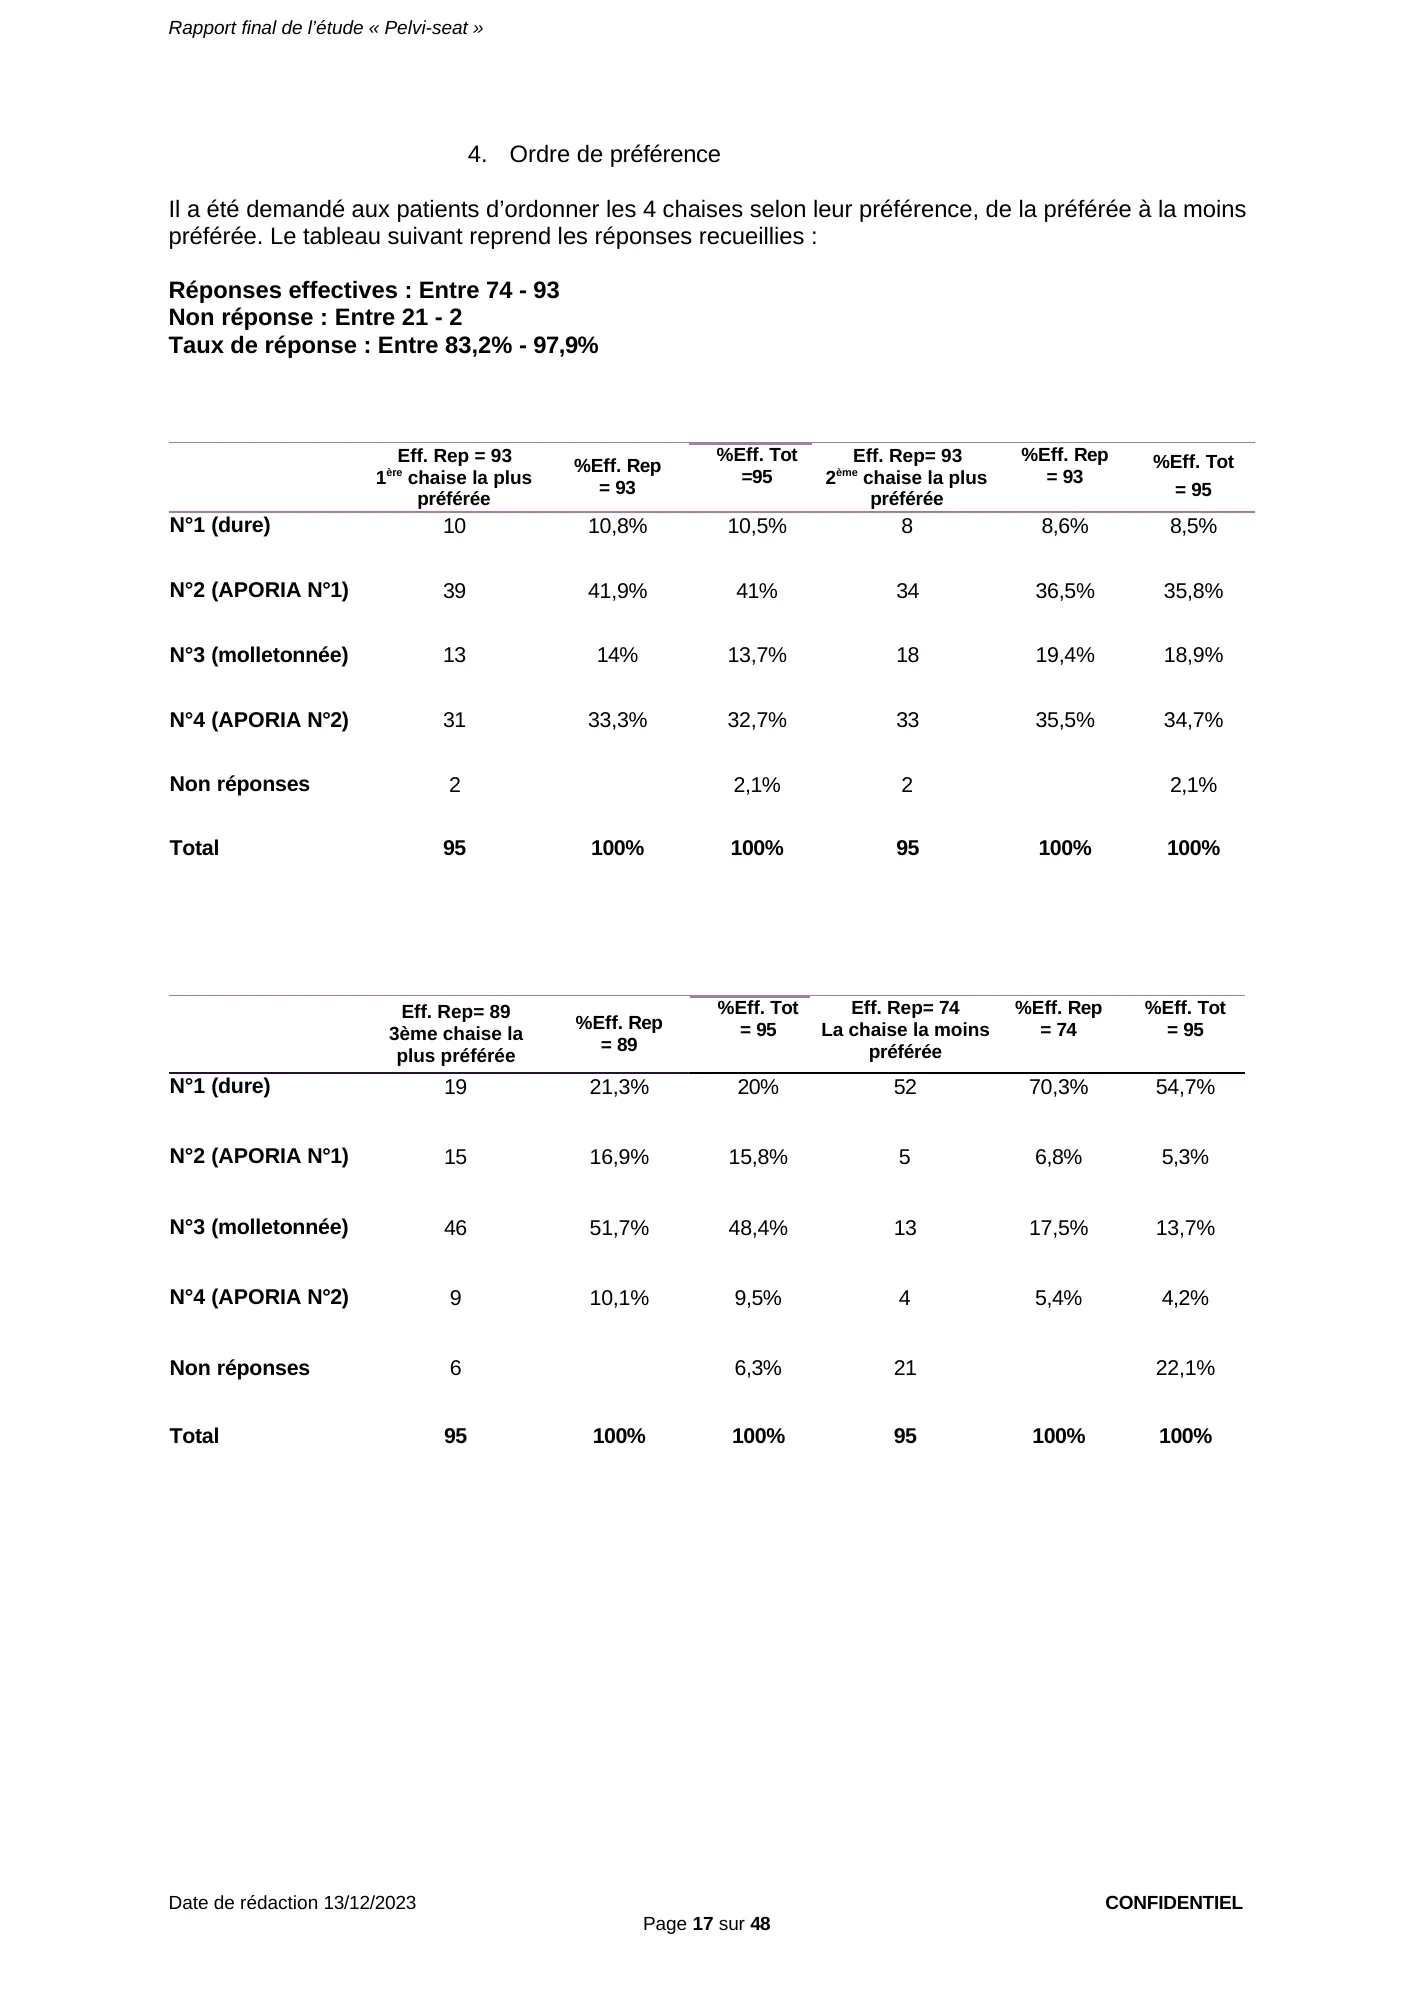
Page 17 — Order of preference, total sample (93 respondents): Aporia® N°1 ranked first by 39 patients (41.9%), Aporia® N°2 by 31 (33.3%); hard chair ranked last by 52 of 74 patients (70.3%).
Report, page 18 of 48 — Order of preference (charts), total sample (95 questionnaires)
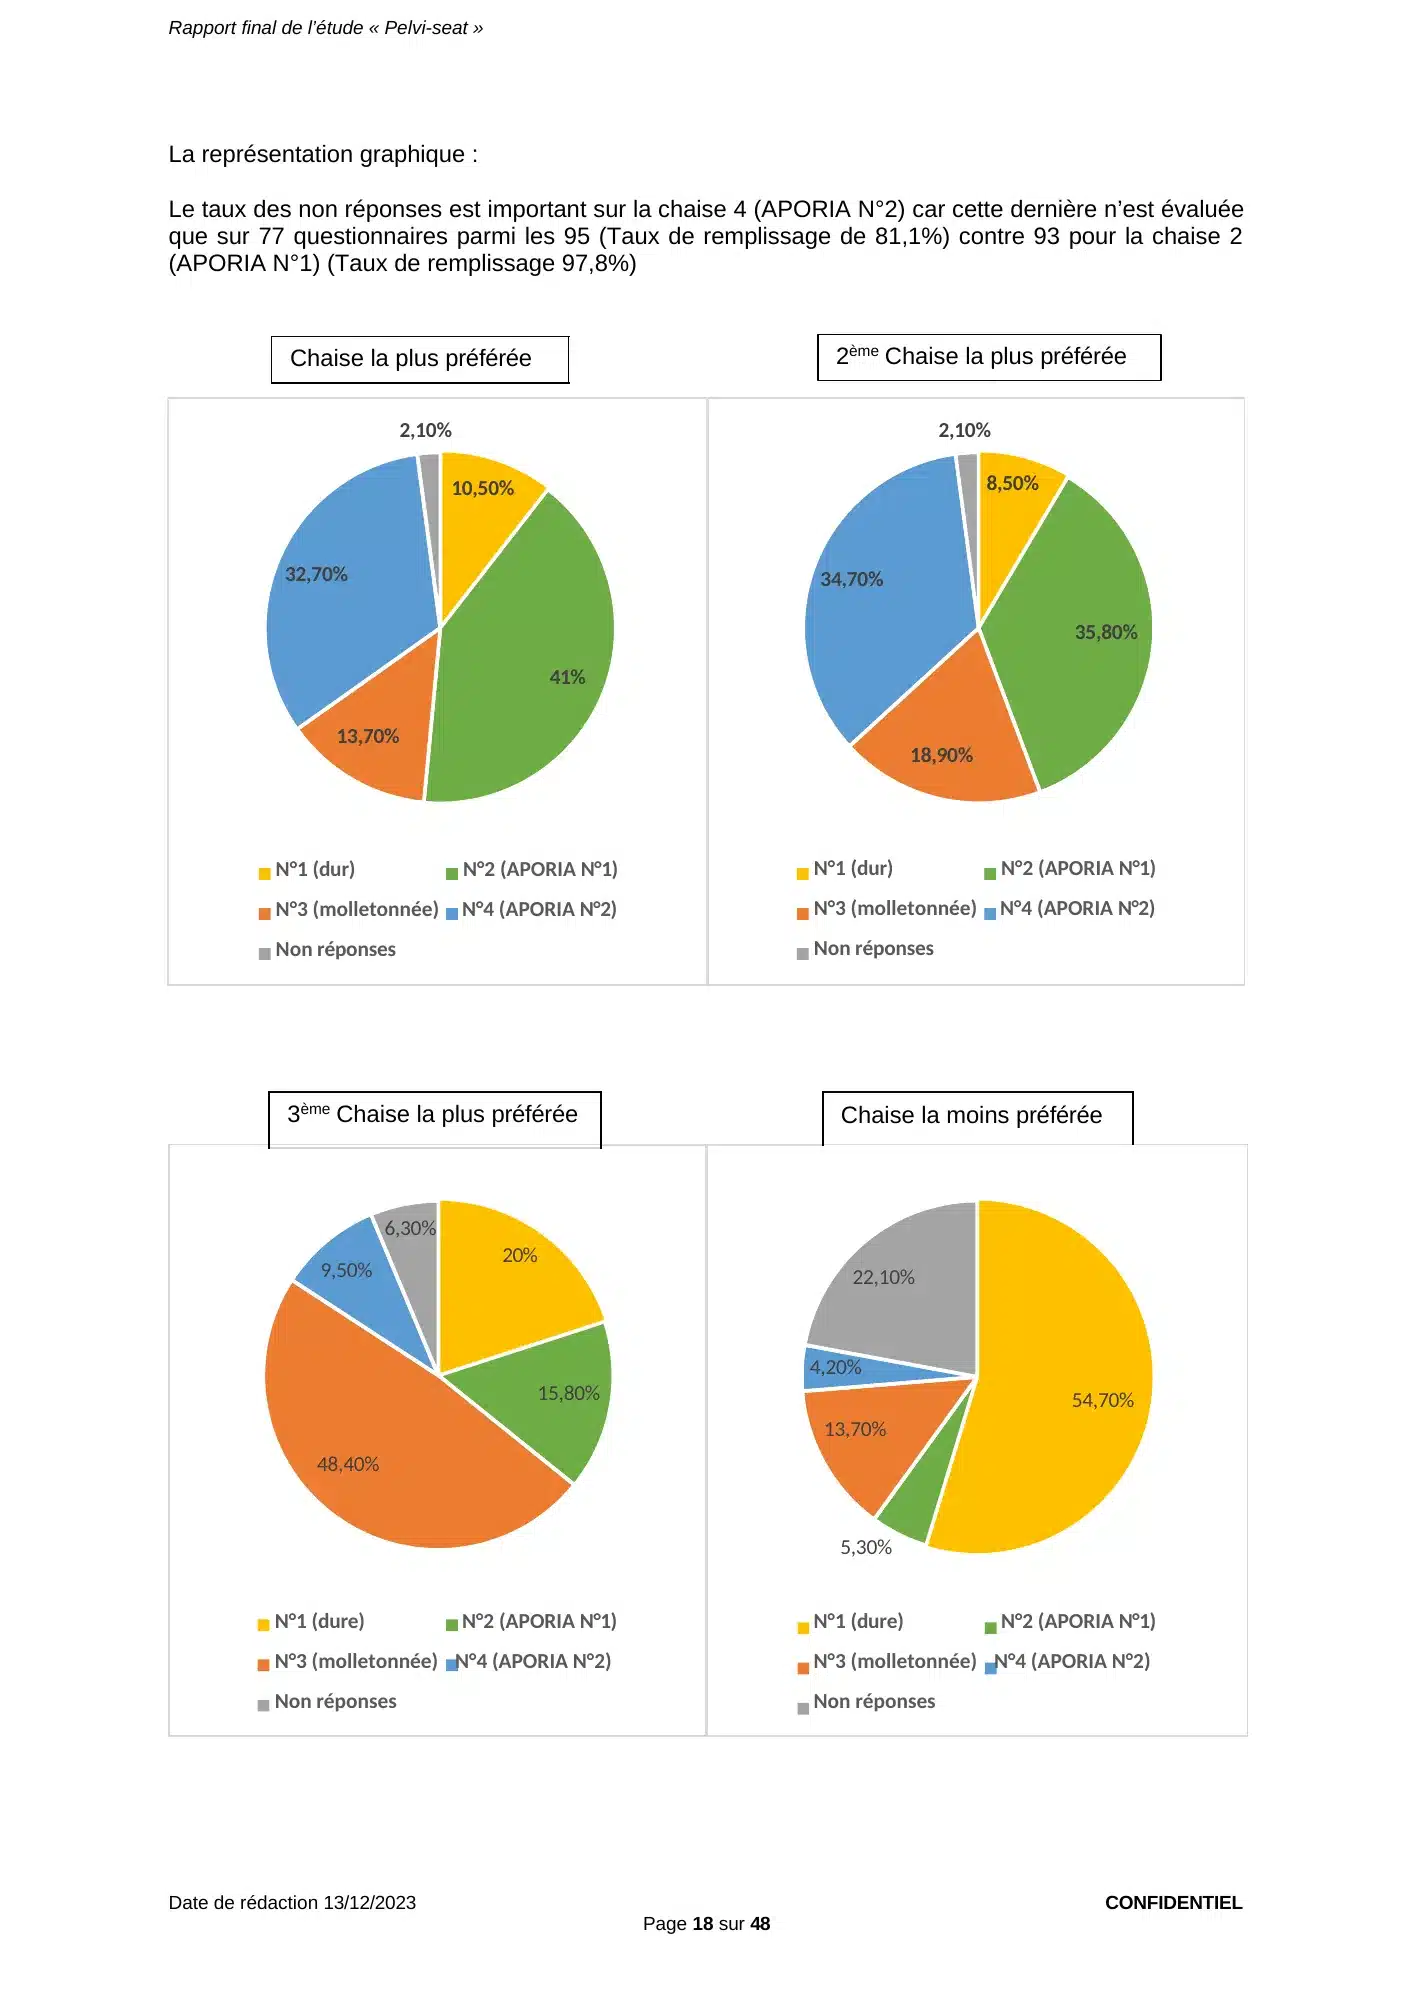
Charts:
The non-response rate is high for chair 4 (APORIA N°2) because it was evaluated in only 77 of the 95 questionnaires (completion rate 81.1%), versus 93 for chair 2 (APORIA N°1) (completion rate 97.8%)
View the original page (page 18 of the report, in French)
Page 18 — Charts of the order of preference for the 4 seats (total sample).
Report, page 19 of 48 — Ranking criteria and pain relieved, total sample (95 questionnaires)
87 answers on the criteria chosen to rank the seats from most to least preferred were collected:
- Actual responses: 87
- No response: 8
- Response rate: 91.6%
- Most frequent answer: Relief of any pain
Note: this is a multiple-choice question, i.e. the patient can tick one or more answers.
| Criterion | Eff. Rep =87 | %Eff. Rep = 87 | %Eff. Tot = 95 |
|---|---|---|---|
| Ergonomics (shape, consistency…) | 38 | 40% | 43.7% |
| Postural support (lumbar support, accompanying movements) | 44 | 46.3% | 50.6% |
| Relief of any pain | 69 | 72.6% | 79.3% |
| No response | 8 | 8.4% | |
| Total | 95 |
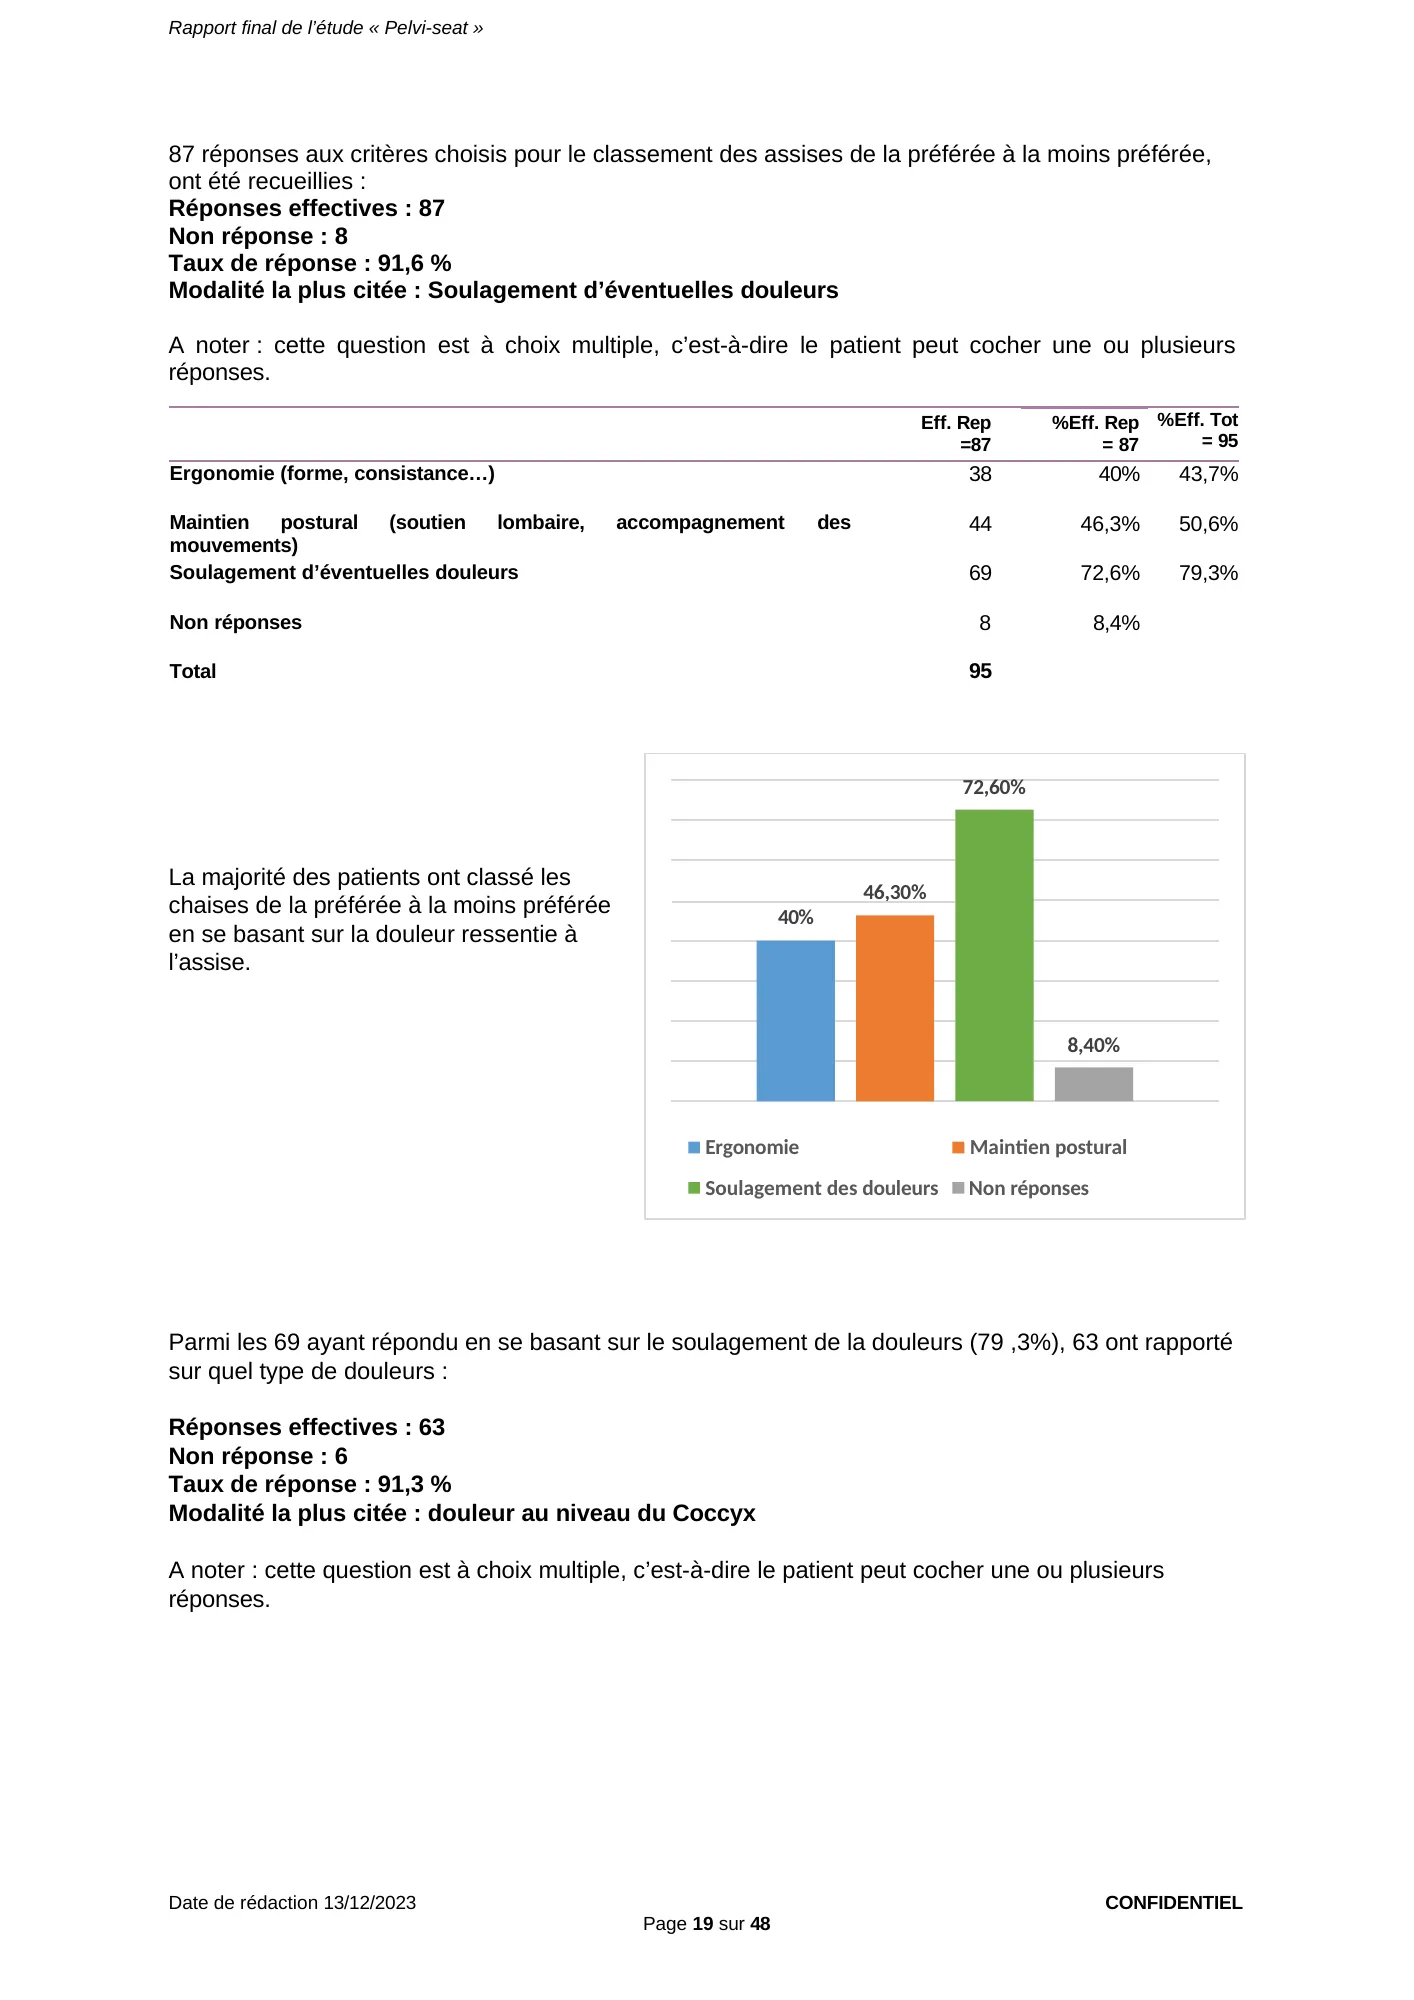
Most patients ranked the chairs from most to least preferred based on the pain felt while seated.
Of the 69 who answered based on pain relief (79.3%), 63 reported the type of pain:
- Actual responses: 63
- No response: 6
- Response rate: 91.3%
- Most frequent answer: pain in the coccyx
Note: this is a multiple-choice question, i.e. the patient can tick one or more answers.
View the original page (page 19 of the report, in French)
Page 19 — Ranking criteria (87 respondents, multiple choice): pain relief cited by 69 patients (79.3% of the total count), ahead of postural support and ergonomics.
Report, page 20 of 48 — Types of pain relieved, total sample (95 questionnaires)
| Type of pain | Eff. Rep =63 | %Eff. Rep. =63 | %Eff. Tot =69 |
|---|---|---|---|
| Pudendal (genital organs) | 33 | 52.4% | 47.8% |
| Cluneal (ischia) | 16 | 25.4% | 23.2% |
| Coccygeal (coccyx) | 41 | 65.1% | 59.4% |
| No response | 6 | 8.7% | |
| Total | 69 |
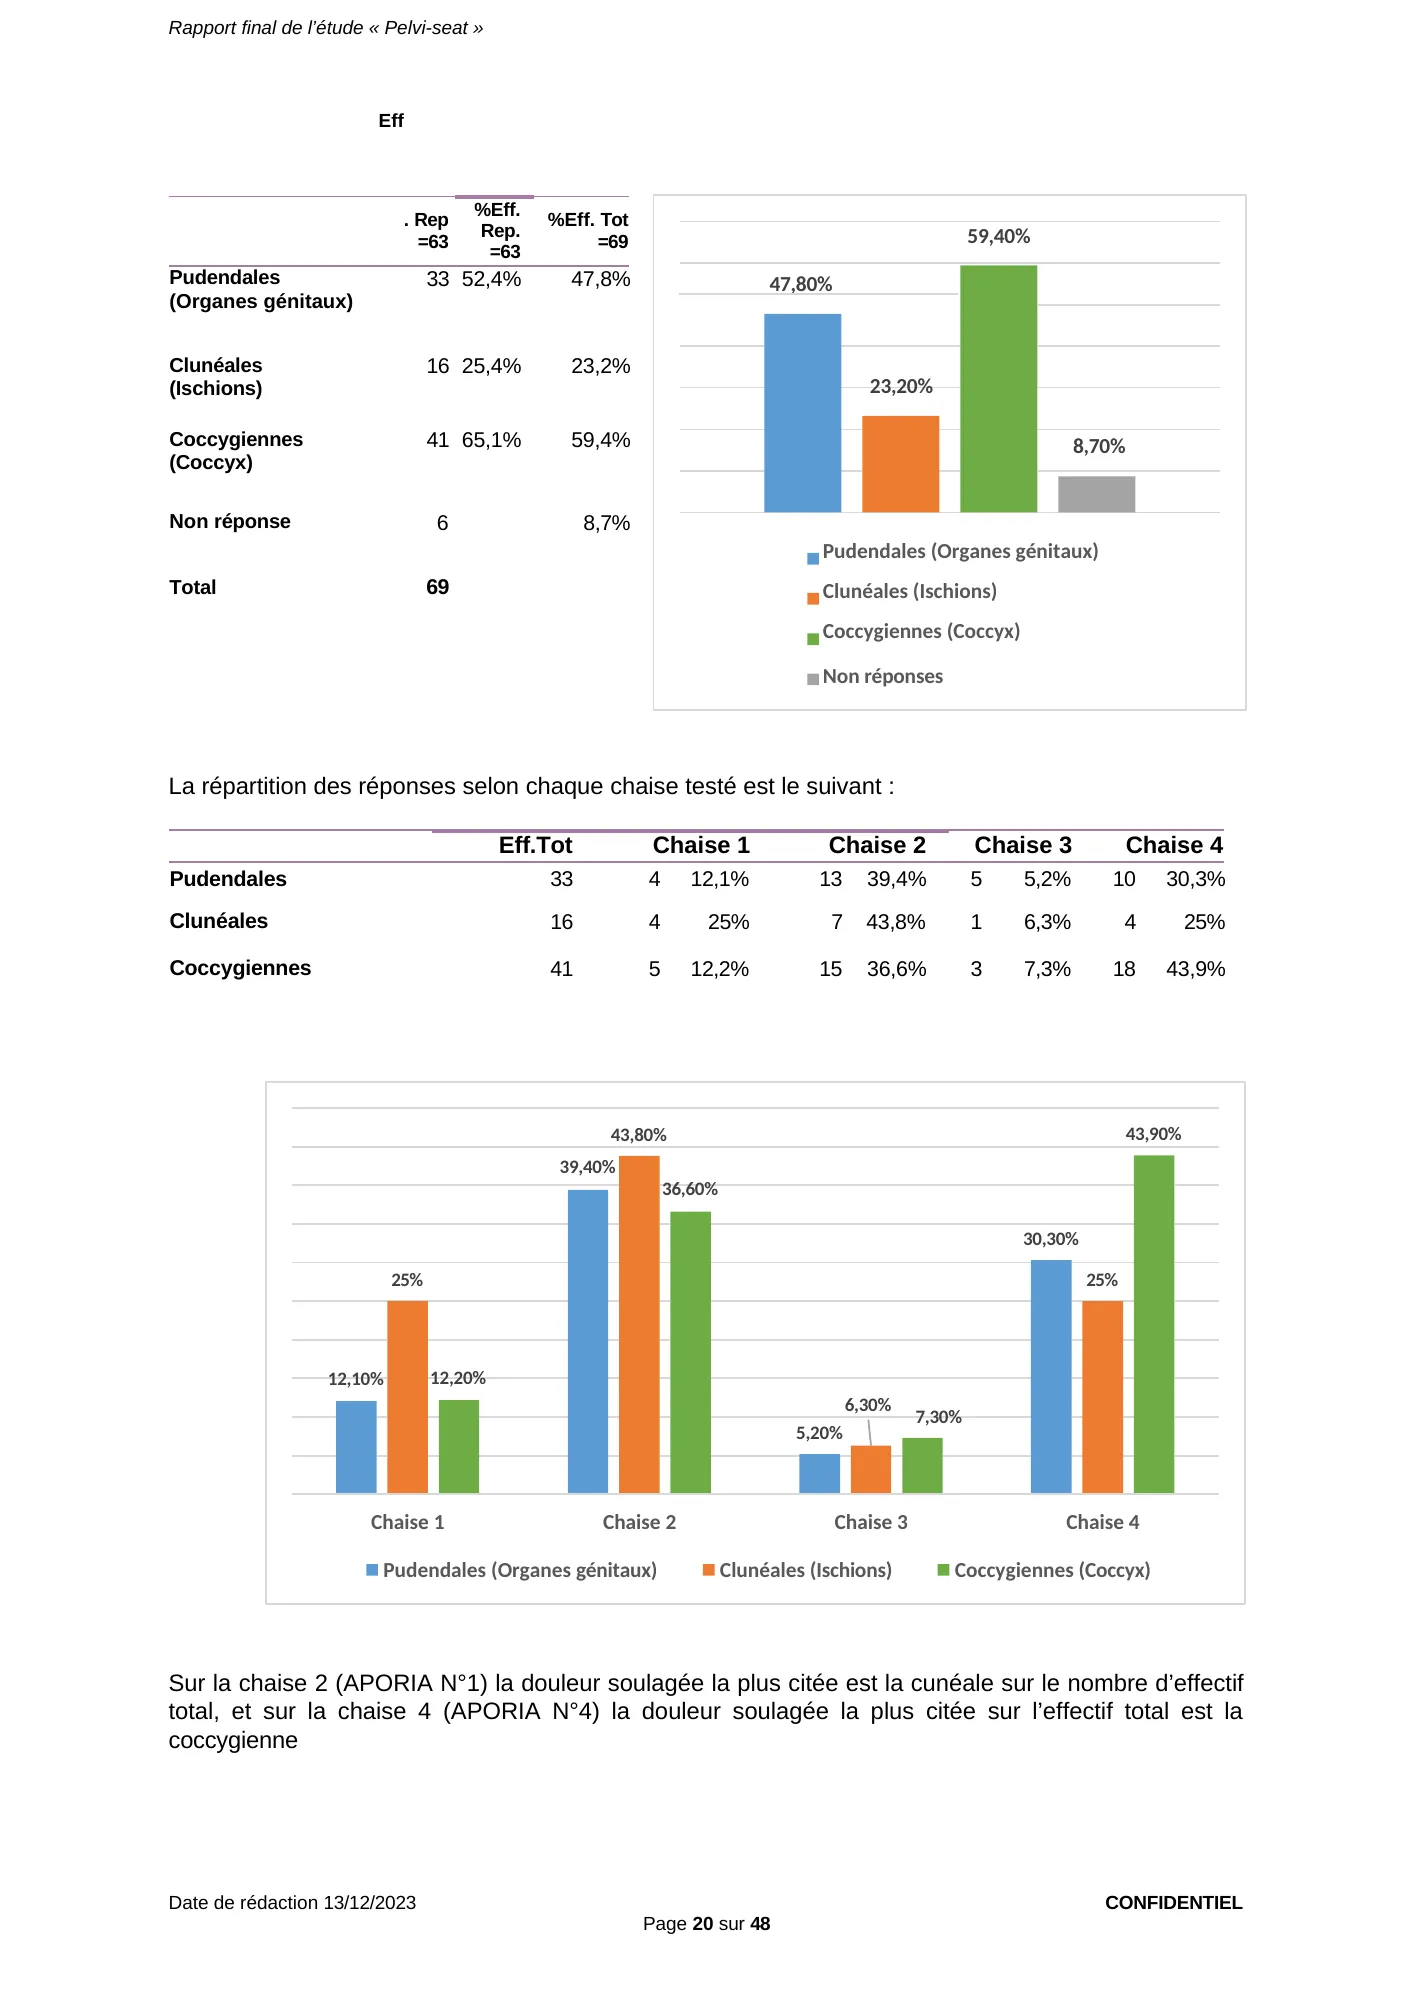
The breakdown of answers for each chair tested is as follows:
| Type of pain | Eff.Tot | Chair 1 | Chair 2 | Chair 3 | Chair 4 |
|---|---|---|---|---|---|
| Pudendal | 33 | 4 — 12.1% | 13 — 39.4% | 5 — 5.2% | 10 — 30.3% |
| Cluneal | 16 | 4 — 25% | 7 — 43.8% | 1 — 6.3% | 4 — 25% |
| Coccygeal | 41 | 5 — 12.2% | 15 — 36.6% | 3 — 7.3% | 18 — 43.9% |
On chair 2 (APORIA N°1) the most frequently cited pain relieved is cluneal pain on the total count, and on chair 4 (APORIA N°4) the most frequently cited pain relieved on the total count is coccygeal pain
View the original page (page 20 of the report, in French)
Page 20 — Pain relieved by chair, total sample: Aporia® N°1 cited by 13 of 33 patients for pudendal pain and 7 of 16 for cluneal pain; Aporia® N°2 by 18 of 41 patients for the coccyx.
Report, page 21 of 48 — Movement and comfort, total sample (95 questionnaires)
4. Movement and comfort
Patients were asked to sit again on one of the APORIA N°1 or N°2 chairs, according to their preference, to assess comfort and quality of movement; yes/no, single-choice and multiple-choice questions were asked, and the results are presented below:
Number of patients who chose to re-test APORIA N°1 or APORIA N°2:
- Actual responses: 94
- No response: 1
- Response rate: 98.9%
- Most frequent answer: APORIA N°1 (chair 2)
| Eff. Rep =94 | %Eff. Rep = 94 | %Eff. Tot = 95 | |
|---|---|---|---|
| APORIA N°1 | 54 | 57.4% | 56.9% |
| APORIA N°2 | 40 | 42.6% | 42.1% |
| No response | 1 | 1% | |
| Total | 95 | 100% | 100% |
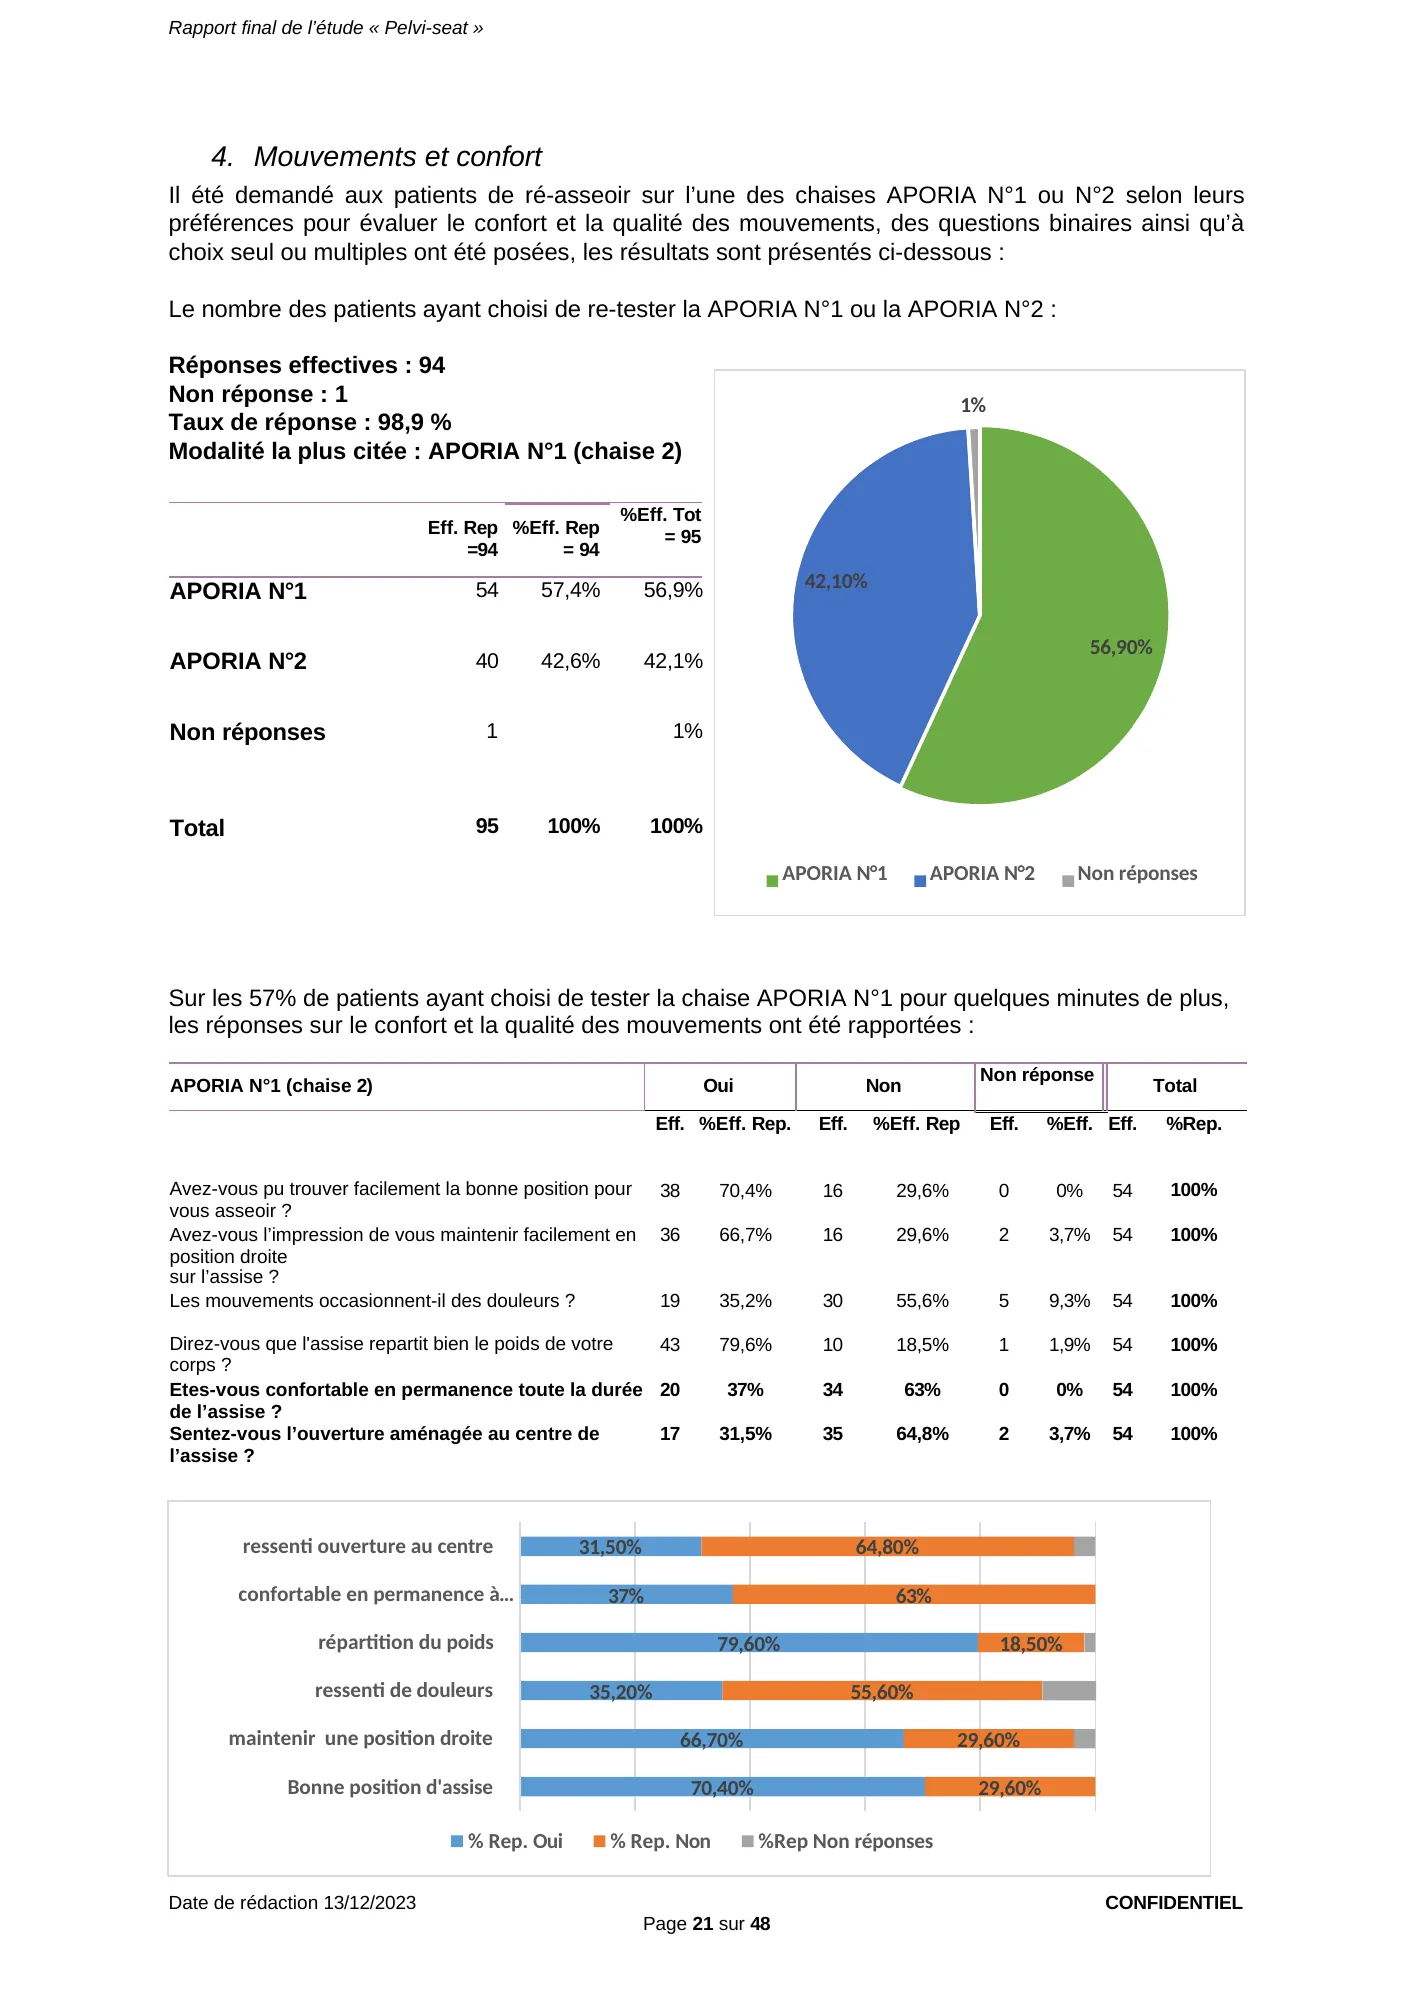
For the 57% of patients who chose to test the APORIA N°1 chair for a few more minutes, the answers on comfort and quality of movement were reported:
| Question | Yes Eff. | Yes %Eff. Rep. | No Eff. | No %Eff. Rep | No response Eff. | No response % | Total Eff. | Total %Rep. |
|---|---|---|---|---|---|---|---|---|
| Could you easily find the right sitting position? | 38 | 70.4% | 16 | 29.6% | 0 | 0% | 54 | 100% |
| Do you feel you can easily stay upright on the seat? | 36 | 66.7% | 16 | 29.6% | 2 | 3.7% | 54 | 100% |
| Do movements cause pain? | 19 | 35.2% | 30 | 55.6% | 5 | 9.3% | 54 | 100% |
| Would you say the seat distributes your body weight well? | 43 | 79.6% | 10 | 18.5% | 1 | 1.9% | 54 | 100% |
| Are you comfortable the whole time you are seated? | 20 | 37% | 34 | 63% | 0 | 0% | 54 | 100% |
| Do you feel the opening in the center of the seat? | 17 | 31.5% | 35 | 64.8% | 2 | 3.7% | 54 | 100% |
View the original page (page 21 of the report, in French)
Page 21 — Re-test: 54 of 94 patients choose the Aporia® N°1, 40 the Aporia® N°2; on the Aporia® N°1, 38 of 54 patients easily find the right position (70.4%).
Report, page 22 of 48 — Movement and comfort, total sample (95 questionnaires)
| Question | Yes Eff. | Yes %Eff. Rep. | No Eff. | No %Eff. Rep | No response Eff. | No response % | Total Eff. | Total %Rep. |
|---|---|---|---|---|---|---|---|---|
| Could you easily find the right sitting position? | 28 | 70% | 11 | 27.5% | 1 | 2.5% | 40 | 100% |
| Do you feel you can easily stay upright on the seat? | 28 | 70% | 11 | 27.5% | 1 | 2.5% | 40 | 100% |
| Do movements cause pain? | 17 | 42.5% | 21 | 52.5% | 2 | 5% | 40 | 100% |
| Would you say the seat distributes your body weight well? | 28 | 70% | 11 | 27.5% | 1 | 2.5% | 40 | 100% |
| Are you comfortable the whole time you are seated? | 18 | 45% | 21 | 52.5% | 1 | 2.5% | 40 | 100% |
| Do you feel the opening in the center of the seat? | 16 | 40% | 23 | 57.5% | 1 | 2.5% | 40 | 100% |
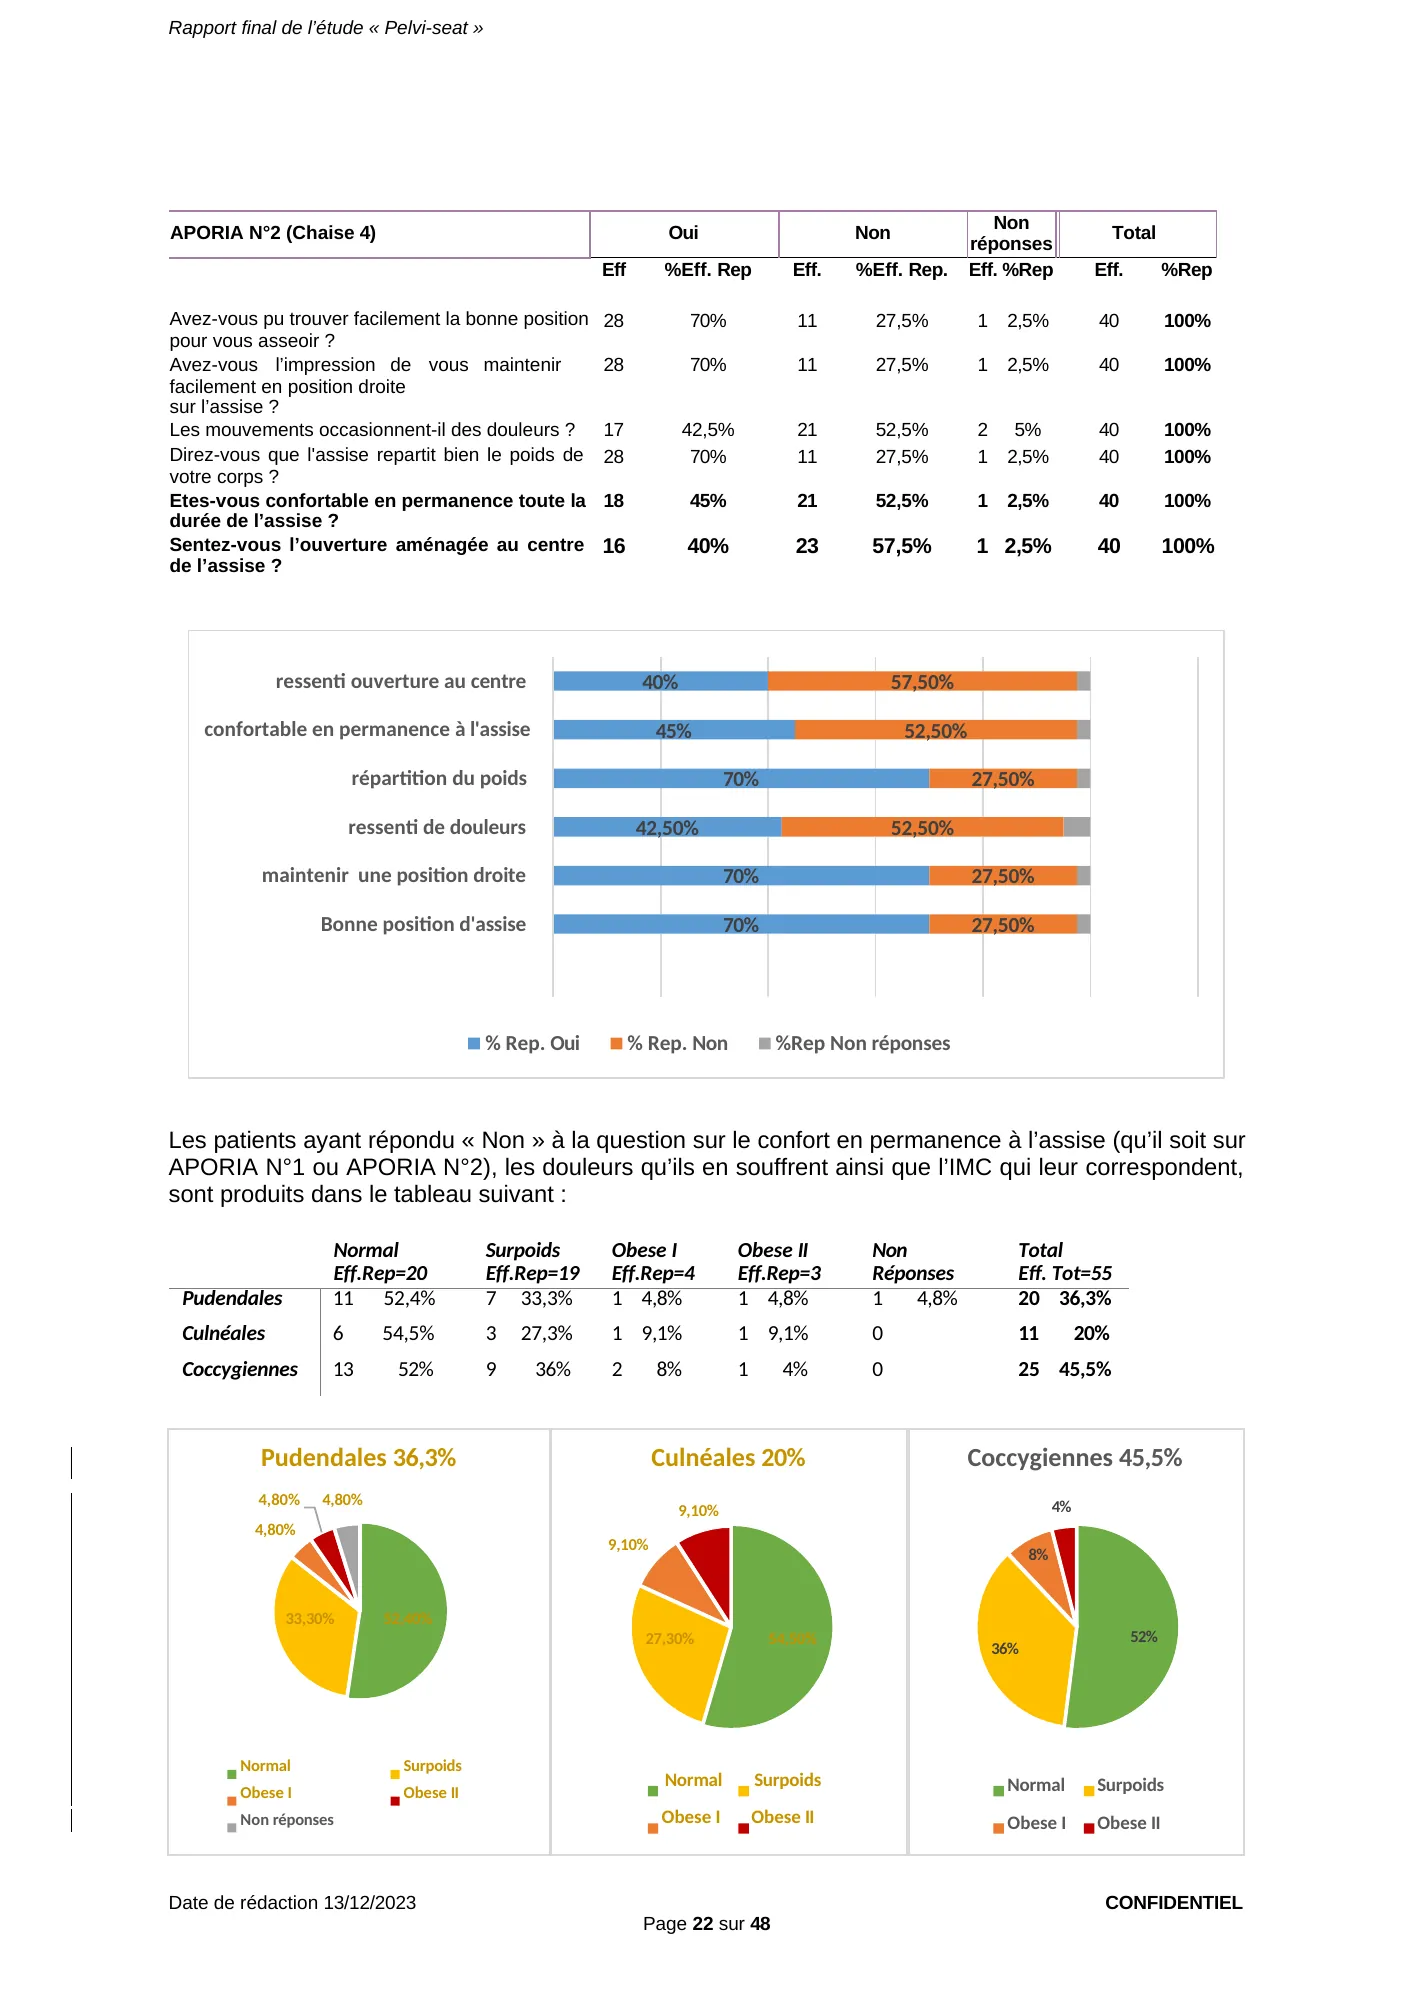
For patients who answered “No” to the question on being comfortable the whole time they were seated (whether on APORIA N°1 or APORIA N°2), the pain they suffer from and their BMI are shown in the following table:
| Type of pain | Normal Eff.Rep=20 | Overweight Eff.Rep=19 | Obese I Eff.Rep=4 | Obese II Eff.Rep=3 | No response | Total Eff. Tot=55 |
|---|---|---|---|---|---|---|
| Pudendal | 11 — 52.4% | 7 — 33.3% | 1 — 4.8% | 1 — 4.8% | 1 — 4.8% | 20 — 36.3% |
| Cluneal | 6 — 54.5% | 3 — 27.3% | 1 — 9.1% | 1 — 9.1% | 0 | 11 — 20% |
| Coccygeal | 13 — 52% | 9 — 36% | 2 — 8% | 1 — 4% | 0 | 25 — 45.5% |
View the original page (page 22 of the report, in French)
Page 22 — Movement and comfort on the Aporia® N°2 (40 patients): 28 easily find the right position, stay upright and find the weight well distributed (70%).
Report, page 23 of 48 — Discomfort felt on the APORIA seats, total sample (95 questionnaires)
Patients with coccygeal pain felt more discomfort on both seats than those with other types of pain.
Half of the patients who were not comfortable the whole time they were seated have a normal BMI.
Patients who answered “No” to the question on being comfortable the whole time reported in which areas they felt discomfort and the type of pain:
Note: answers are multiple-choice.
- Actual responses: 34 for APORIA N°1, 21 for APORIA N°2
- No response: 0 for APORIA N°1, 1 for APORIA N°2
- Response rate: 100%, 95.5%
- Most frequent answer: Buttocks on APORIA N°1, Other on APORIA N°2
| Area | Eff. APORIA N°1 | %Eff. Rep =34 | Eff. APORIA N°2 | %Eff.Rep =21 | %Eff.Tot =22 |
|---|---|---|---|---|---|
| Thighs | 1 | 2.3% | 4 | 19% | 18% |
| Buttocks | 20 | 45.5% | 9 | 43% | 41% |
| Perineum | 9 | 20.5% | 6 | 28.6% | 27% |
| Other | 11 | 25% | 10 | 47.6% | 45% |
| No response | 0 | 0% | 1 | 4.5% | |
| Total | 34 | 22 |
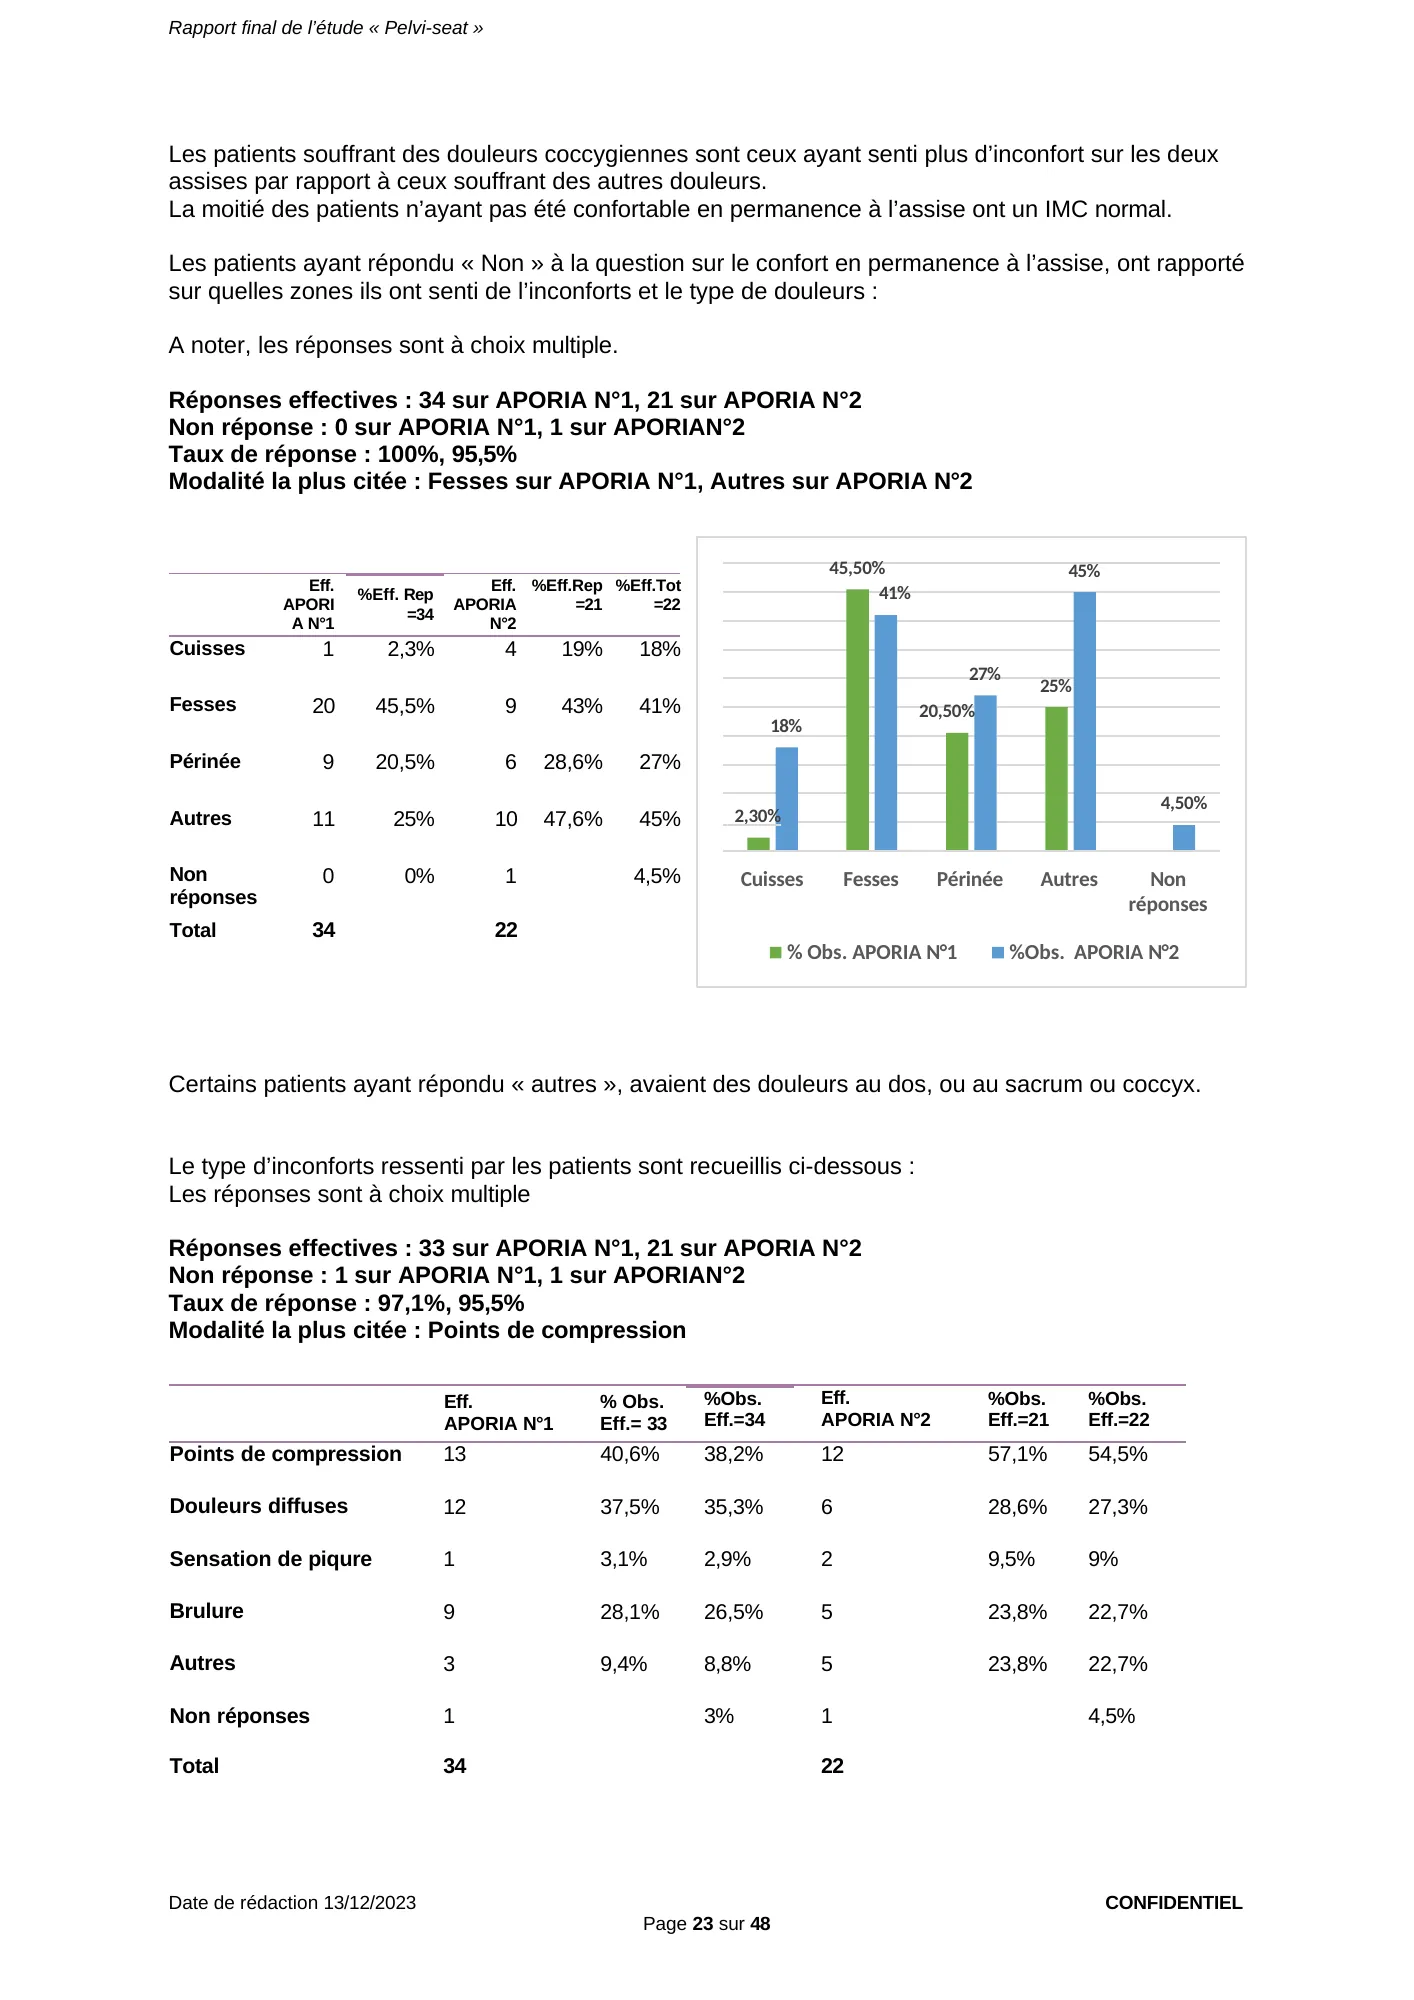
Some patients who answered “other” had pain in the back, the sacrum or the coccyx.
The types of discomfort felt by patients are shown below:
Answers are multiple-choice
- Actual responses: 33 for APORIA N°1, 21 for APORIA N°2
- No response: 1 for APORIA N°1, 1 for APORIA N°2
- Response rate: 97.1%, 95.5%
- Most frequent answer: Pressure points
| Type | Eff. APORIA N°1 | % Obs. Eff.= 33 | %Obs. Eff.=34 | Eff. APORIA N°2 | %Obs. Eff.=21 | %Obs. Eff.=22 |
|---|---|---|---|---|---|---|
| Pressure points | 13 | 40.6% | 38.2% | 12 | 57.1% | 54.5% |
| Diffuse pain | 12 | 37.5% | 35.3% | 6 | 28.6% | 27.3% |
| Stinging sensation | 1 | 3.1% | 2.9% | 2 | 9.5% | 9% |
| Burning | 9 | 28.1% | 26.5% | 5 | 23.8% | 22.7% |
| Other | 3 | 9.4% | 8.8% | 5 | 23.8% | 22.7% |
| No response | 1 | 3% | 1 | 4.5% | ||
| Total | 34 | 22 |
View the original page (page 23 of the report, in French)
Page 23 — Areas and types of discomfort on the Aporia® seats (buttocks, perineum, pressure points); patients with coccyx pain report the most discomfort.
Report, page 24 of 48 — Central opening of the APORIA seats, total sample (95 questionnaires)
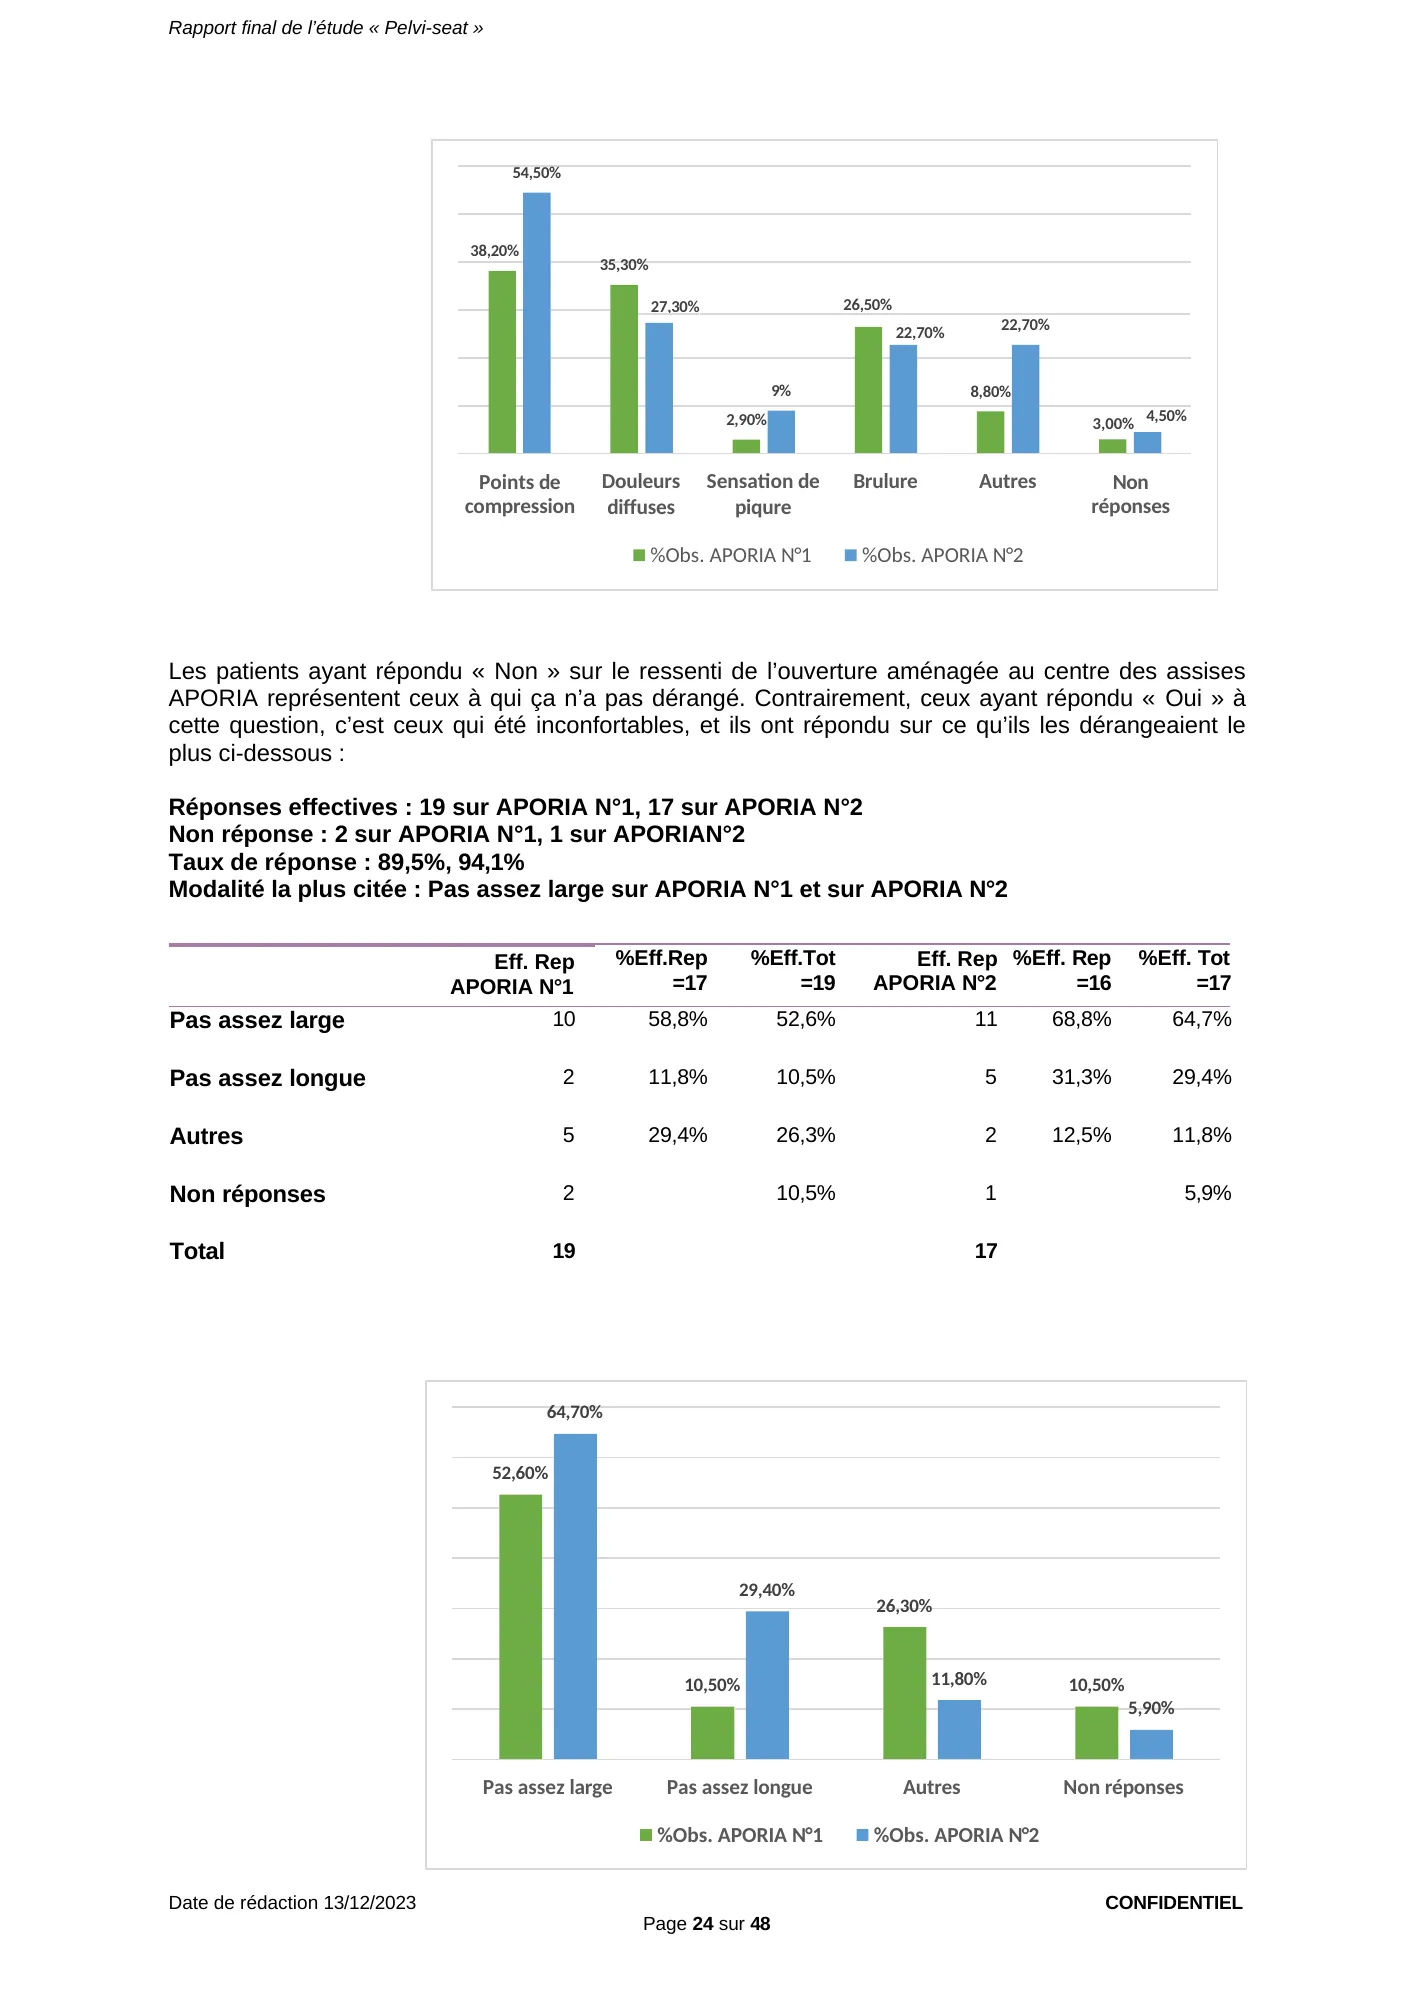
Patients who answered “No” about feeling the opening in the center of the APORIA seats are those who were not bothered by it. Conversely, those who answered “Yes” to this question were uncomfortable, and they reported what bothered them most below:
- Actual responses: 19 for APORIA N°1, 17 for APORIA N°2
- No response: 2 for APORIA N°1, 1 for APORIA N°2
- Response rate: 89.5%, 94.1%
- Most frequent answer: Not wide enough on APORIA N°1 and on APORIA N°2
| Answer | Eff. Rep APORIA N°1 | %Eff.Rep =17 | %Eff.Tot =19 | Eff. Rep APORIA N°2 | %Eff. Rep =16 | %Eff. Tot =17 |
|---|---|---|---|---|---|---|
| Not wide enough | 10 | 58.8% | 52.6% | 11 | 68.8% | 64.7% |
| Not long enough | 2 | 11.8% | 10.5% | 5 | 31.3% | 29.4% |
| Other | 5 | 29.4% | 26.3% | 2 | 12.5% | 11.8% |
| No response | 2 | 10.5% | 1 | 5.9% | ||
| Total | 19 | 17 |
View the original page (page 24 of the report, in French)
Page 24 — Perception of the central opening of the Aporia® seats: when it bothers patients, it is judged “not wide enough”.
Report, page 25 of 48 — Central opening and range of movement, total sample (95 questionnaires)
In the 7 other answers, some patients found the seat (APORIA N°1 or APORIA N°2) not thick enough.
For the 21 “Not wide enough” answers about the central opening of the seats, the type of pain these patients suffer from and their BMI are as follows:
| Type of pain | Eff. Tot =21 | Normal Eff.Rep=11 | Overweight Eff.Rep=10 | Obese I Eff.Rep=1 |
|---|---|---|---|---|
| Pudendal | 7 — 33.3% | 3 — 42.9% | 4 — 57.1% | 0 |
| Cluneal | 3 — 14.3% | 2 — 66.7% | 1 — 33.3% | 0 |
| Coccygeal | 11 — 52.4% | 6 — 54.5% | 5 — 45.5% | 1 — 9.1% |
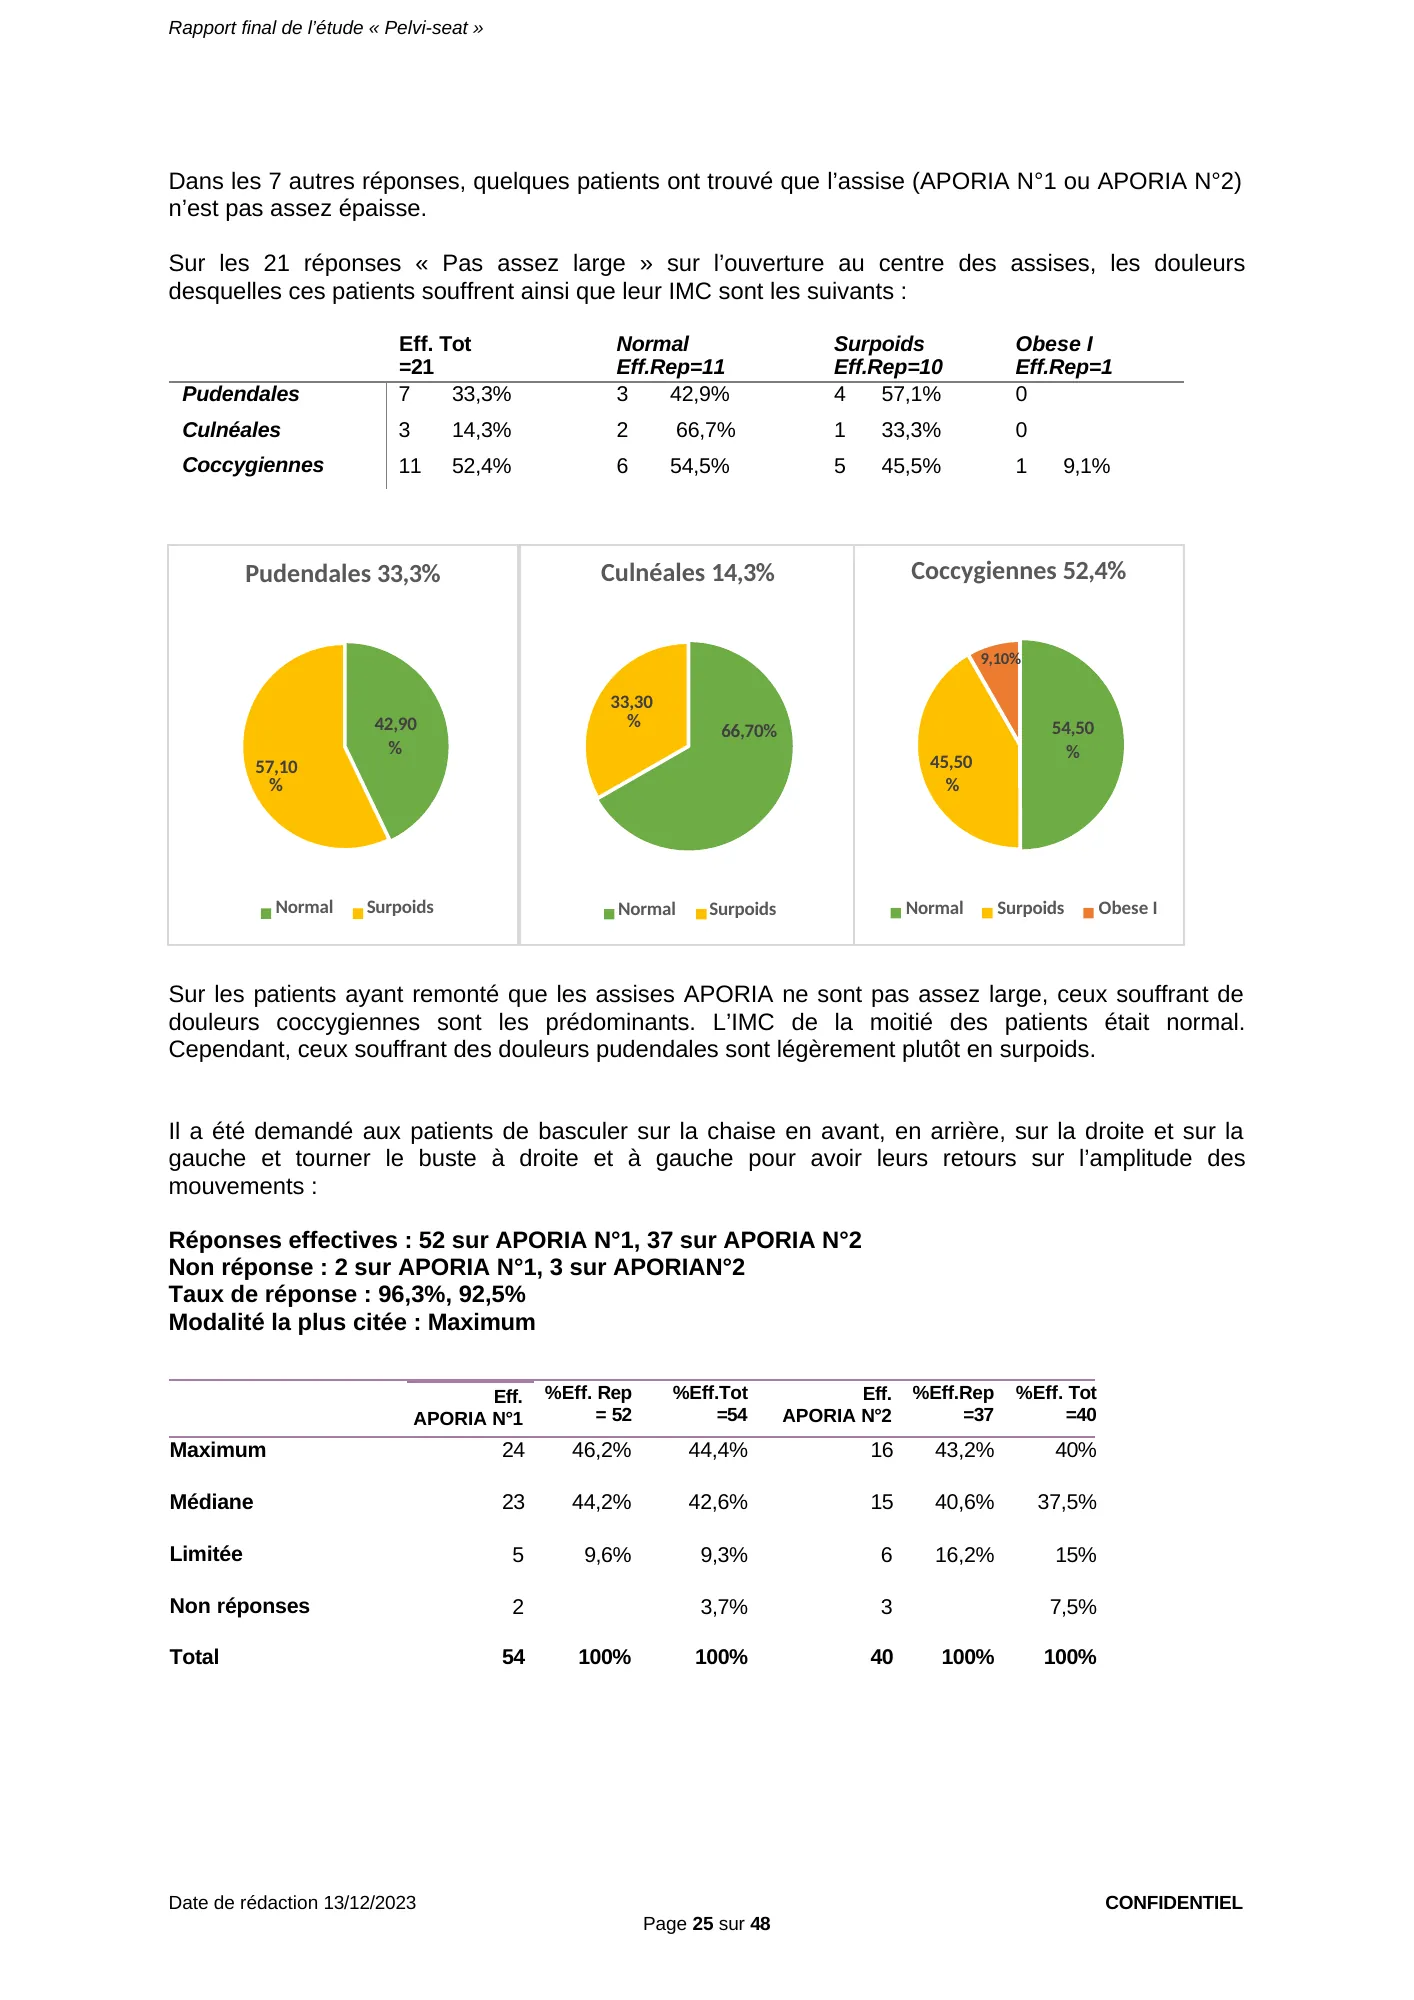
Among the patients who reported that the APORIA seats are not wide enough, those with coccygeal pain predominate. Half of the patients had a normal BMI. However, those with pudendal pain tend to be slightly overweight.
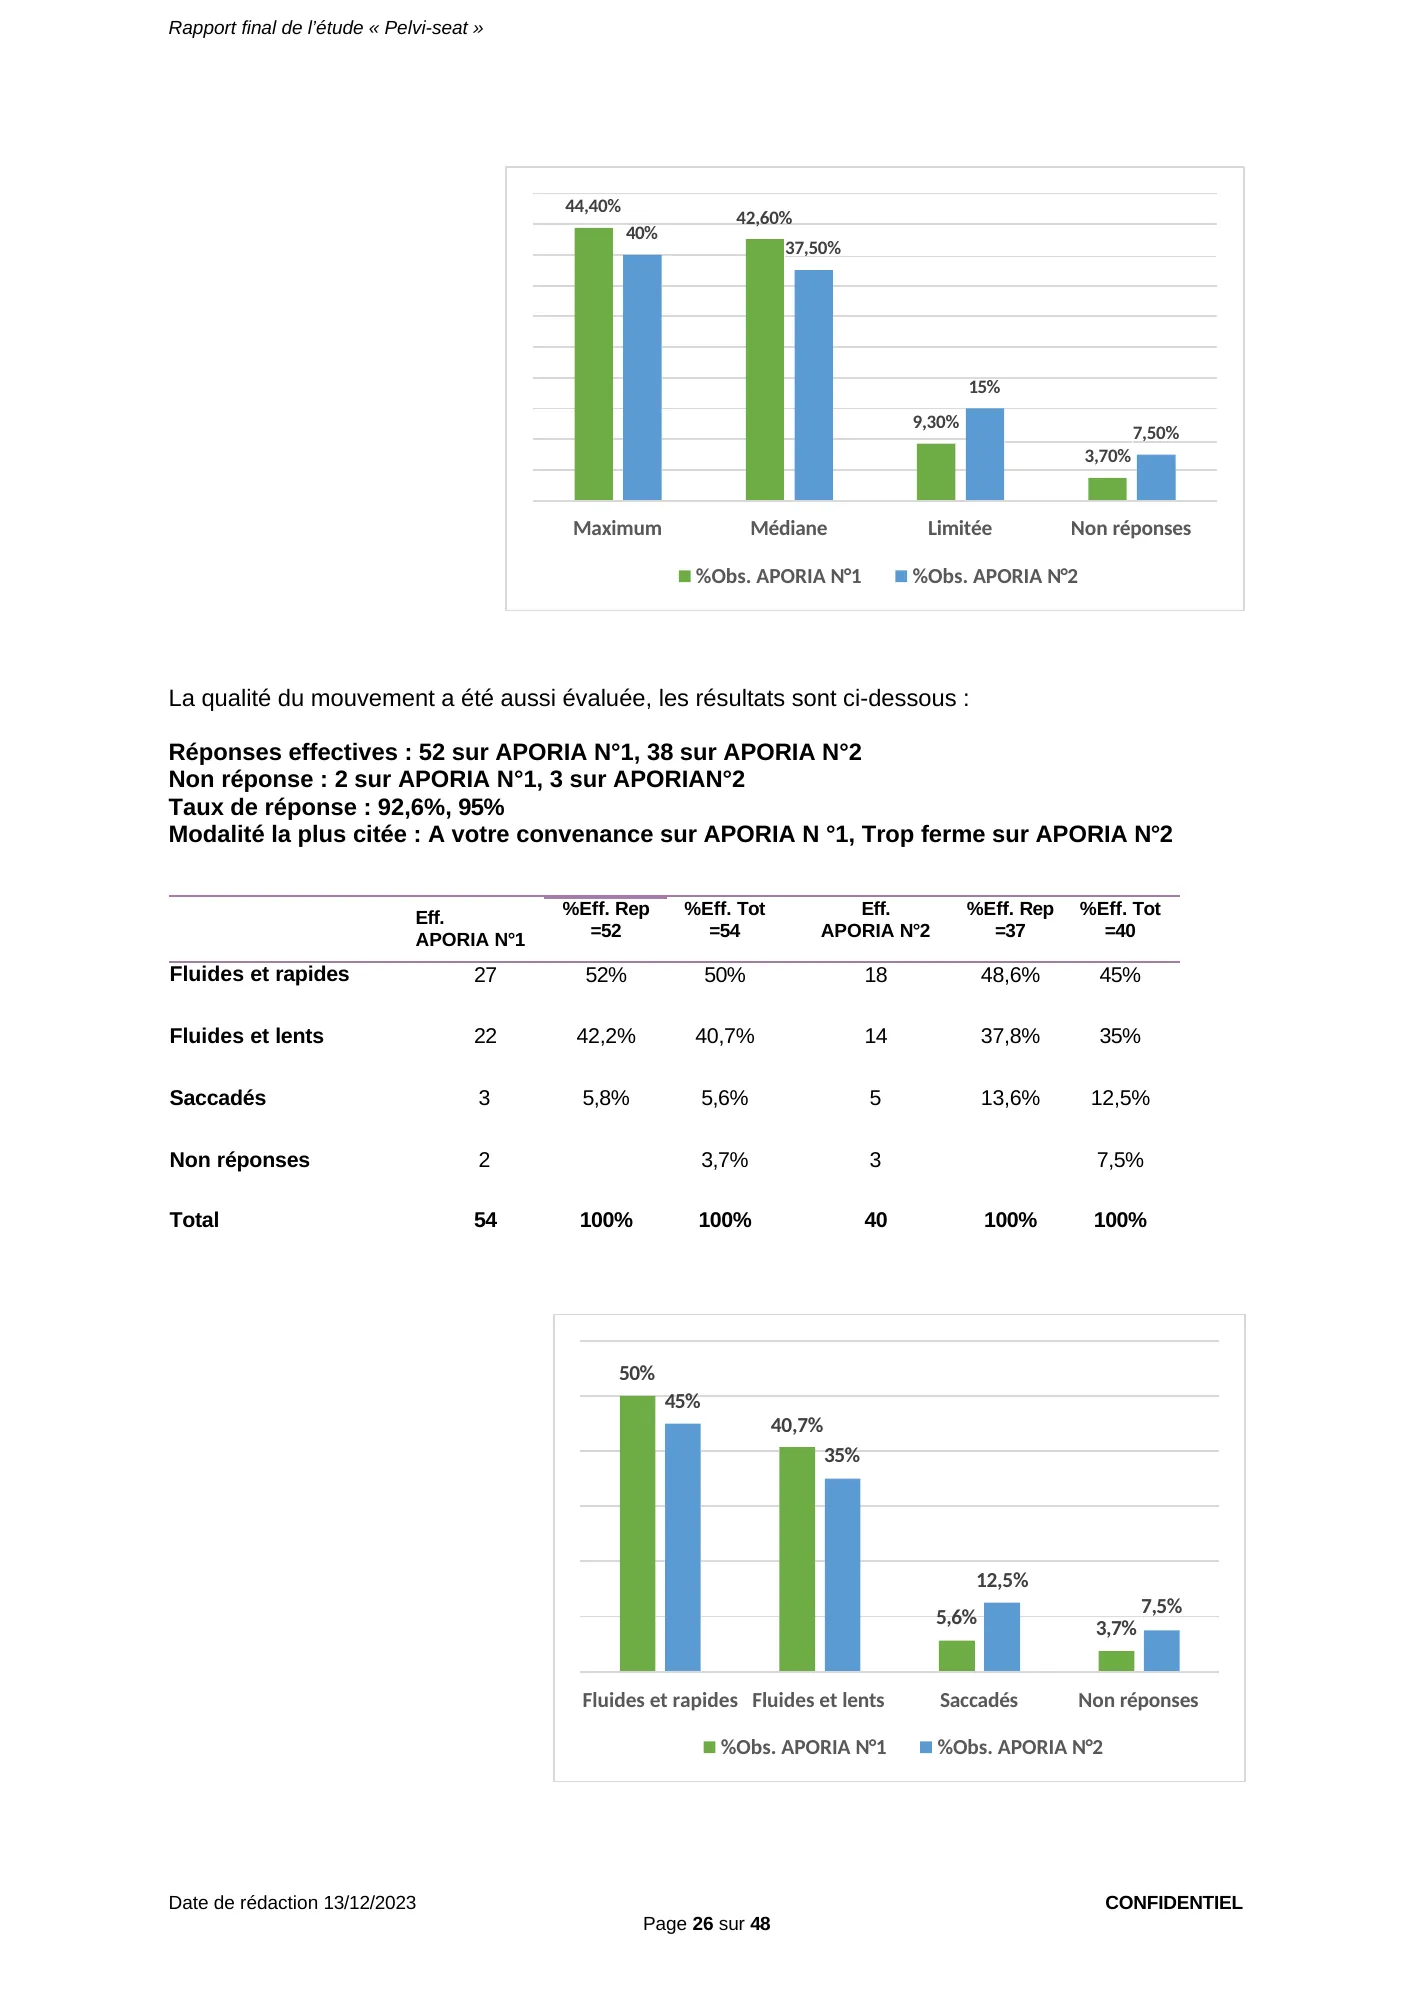
Patients were asked to tilt forward, backward, to the right and to the left on the chair, and to rotate the trunk to the right and to the left, to give feedback on the range of movement:
- Actual responses: 52 for APORIA N°1, 37 for APORIA N°2
- No response: 2 for APORIA N°1, 3 for APORIA N°2
- Response rate: 96.3%, 92.5%
- Most frequent answer: Maximum
| Range | Eff. APORIA N°1 | %Eff. Rep = 52 | %Eff.Tot =54 | Eff. APORIA N°2 | %Eff.Rep =37 | %Eff. Tot =40 |
|---|---|---|---|---|---|---|
| Maximum | 24 | 46.2% | 44.4% | 16 | 43.2% | 40% |
| Medium | 23 | 44.2% | 42.6% | 15 | 40.6% | 37.5% |
| Limited | 5 | 9.6% | 9.3% | 6 | 16.2% | 15% |
| No response | 2 | 3.7% | 3 | 7.5% | ||
| Total | 54 | 100% | 100% | 40 | 100% | 100% |
View the original page (page 25 of the report, in French)
Page 25 — Profile of patients who find the central opening too narrow: mostly coccyx pain, normal BMI for half of them.
Report, page 26 of 48 — Range and quality of movement, total sample (95 questionnaires)
The quality of movement was also assessed; the results are below:
- Actual responses: 52 for APORIA N°1, 38 for APORIA N°2
- No response: 2 for APORIA N°1, 3 for APORIA N°2
- Response rate: 92.6%, 95%
- Most frequent answer: Just right on APORIA N°1, Too firm on APORIA N°2
| Quality | Eff. APORIA N°1 | %Eff. Rep =52 | %Eff. Tot =54 | Eff. APORIA N°2 | %Eff. Rep =37 | %Eff. Tot =40 |
|---|---|---|---|---|---|---|
| Smooth and quick | 27 | 52% | 50% | 18 | 48.6% | 45% |
| Smooth and slow | 22 | 42.2% | 40.7% | 14 | 37.8% | 35% |
| Jerky | 3 | 5.8% | 5.6% | 5 | 13.6% | 12.5% |
| No response | 2 | 3.7% | 3 | 7.5% | ||
| Total | 54 | 100% | 100% | 40 | 100% | 100% |
View the original page (page 26 of the report, in French)
Page 26 — Range and quality of movement on Aporia® N°1 and N°2: smooth movements for the large majority of patients.
Report, page 27 of 48 — Support and comparative comfort, total sample (95 questionnaires)
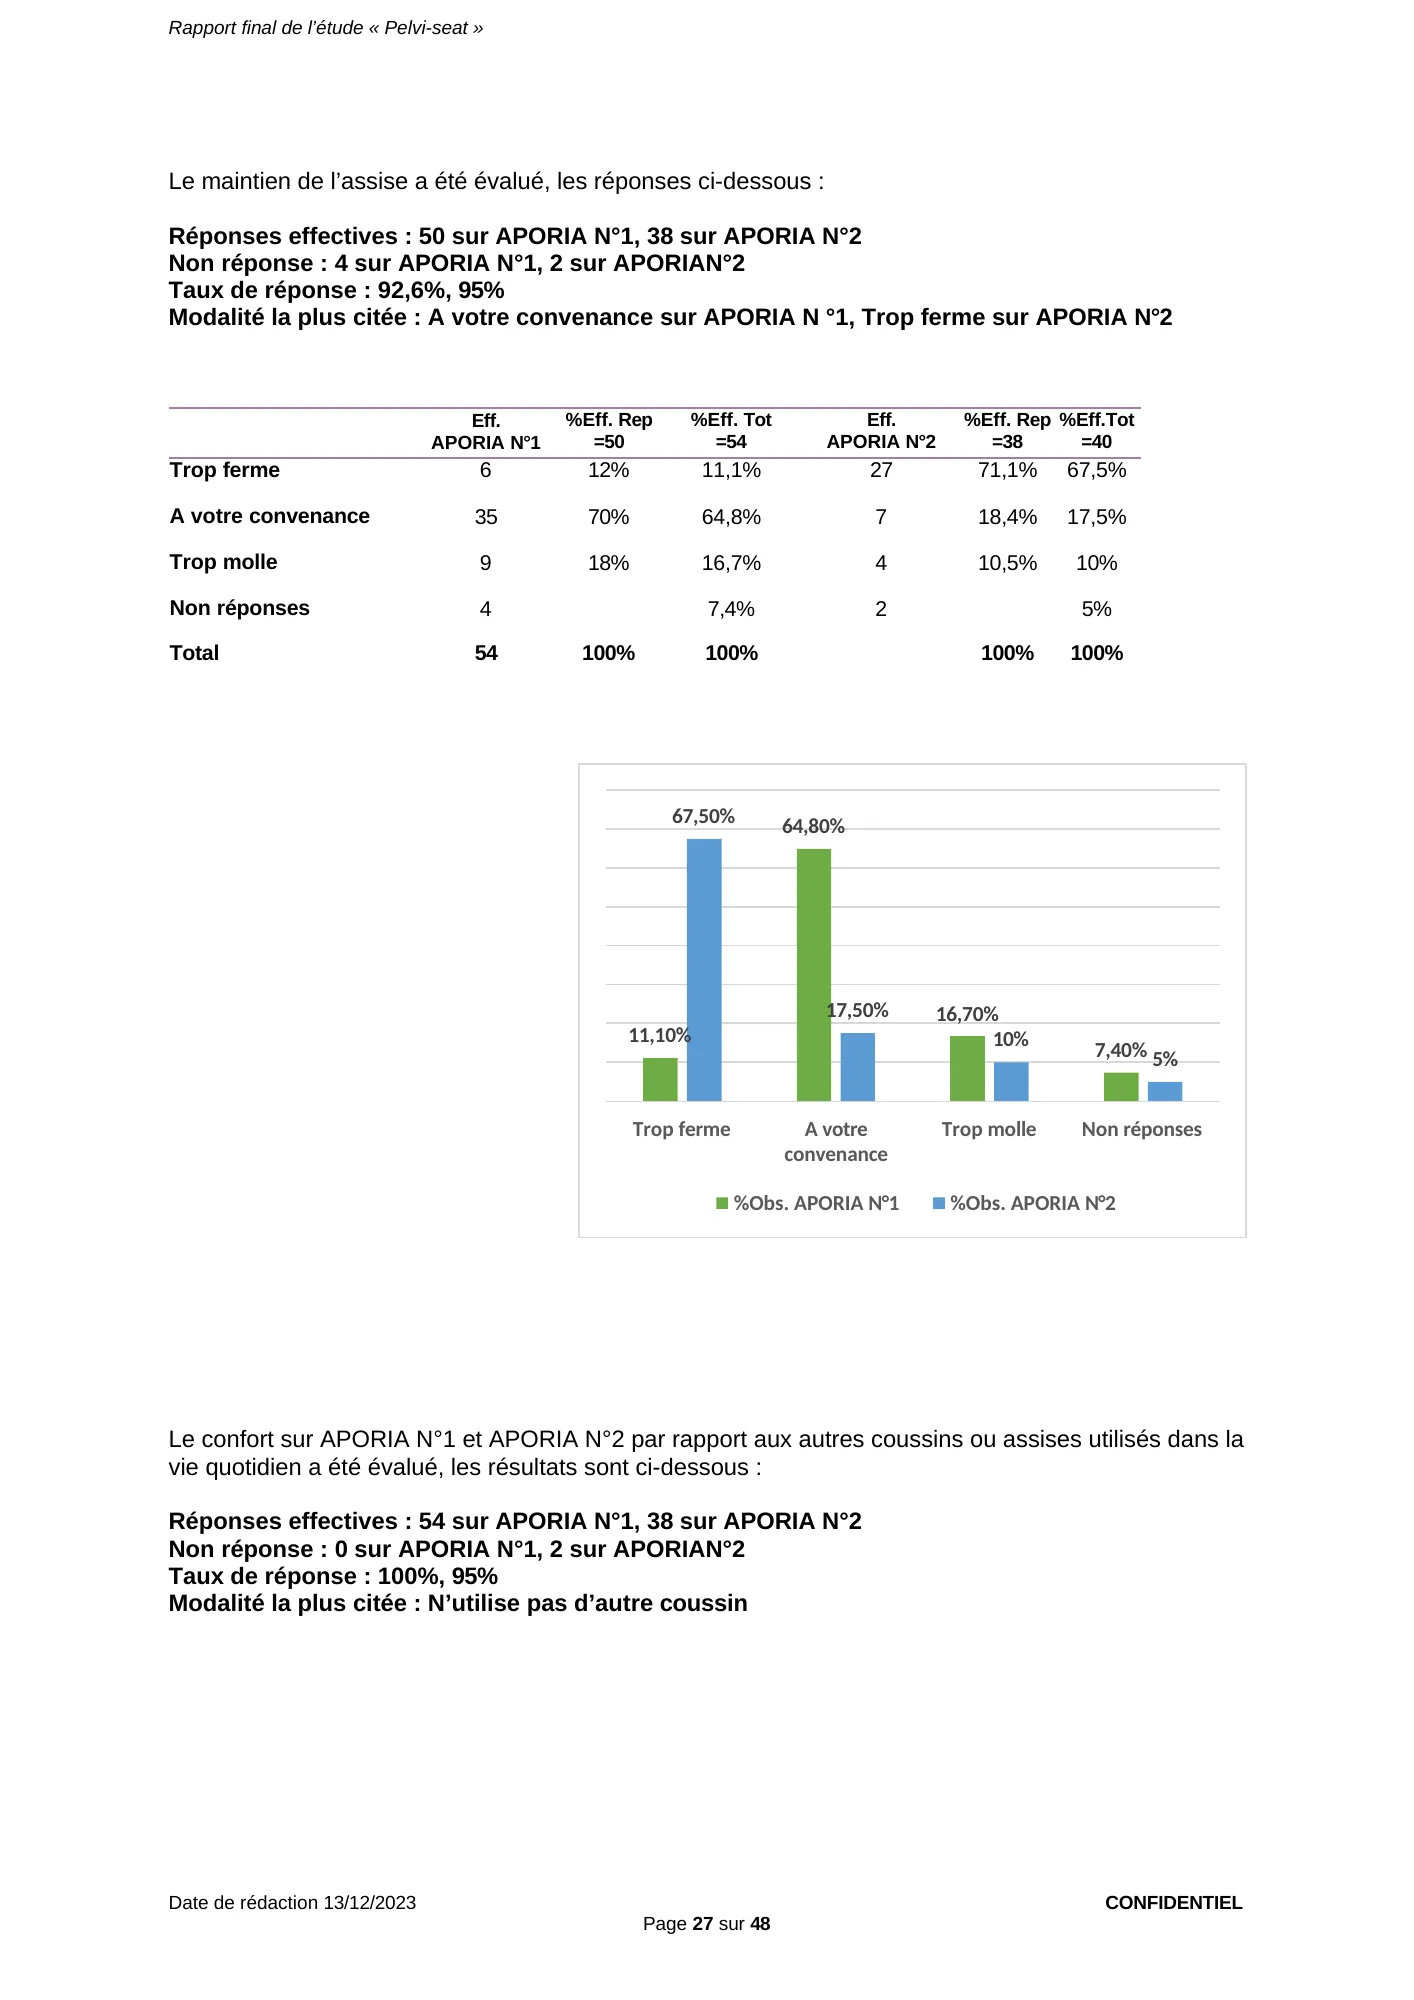
Seat support was assessed; the answers are below:
- Actual responses: 50 for APORIA N°1, 38 for APORIA N°2
- No response: 4 for APORIA N°1, 2 for APORIA N°2
- Response rate: 92.6%, 95%
- Most frequent answer: Just right on APORIA N°1, Too firm on APORIA N°2
| Answer | Eff. APORIA N°1 | %Eff. Rep =50 | %Eff. Tot =54 | Eff. APORIA N°2 | %Eff. Rep =38 | %Eff.Tot =40 |
|---|---|---|---|---|---|---|
| Too firm | 6 | 12% | 11.1% | 27 | 71.1% | 67.5% |
| Just right | 35 | 70% | 64.8% | 7 | 18.4% | 17.5% |
| Too soft | 9 | 18% | 16.7% | 4 | 10.5% | 10% |
| No response | 4 | 7.4% | 2 | 5% | ||
| Total | 54 | 100% | 100% | 100% | 100% |
Comfort on APORIA N°1 and APORIA N°2 compared with other cushions or seats used in daily life was assessed; the results are below:
- Actual responses: 54 for APORIA N°1, 38 for APORIA N°2
- No response: 0 for APORIA N°1, 2 for APORIA N°2
- Response rate: 100%, 95%
- Most frequent answer: N’utilise pas d’autre coussin
View the original page (page 27 of the report, in French)
Page 27 — Firmness: Aporia® N°1 “just right” for 35 of 50 respondents (70%); Aporia® N°2 judged too firm by 27 of 38 (71.1%).
Report, page 28 of 48 — Comparative comfort and relief of other pain, total sample (95 questionnaires)
| Answer | Eff. APORIA N°1 | %Eff. Rep =54 | Eff. APORIA N°2 | %Eff. Rep =38 | %Eff. Tot =40 |
|---|---|---|---|---|---|
| Yes | 15 | 27.8% | 15 | 39.5% | 37.5% |
| No | 8 | 14.8% | 6 | 15.8% | 15% |
| Does not use a cushion | 31 | 57.4% | 17 | 44.7% | 42.5% |
| No response | 0 | 0% | 2 | 5% | |
| Total | 54 | 100% | 38 | 100% | 100% |
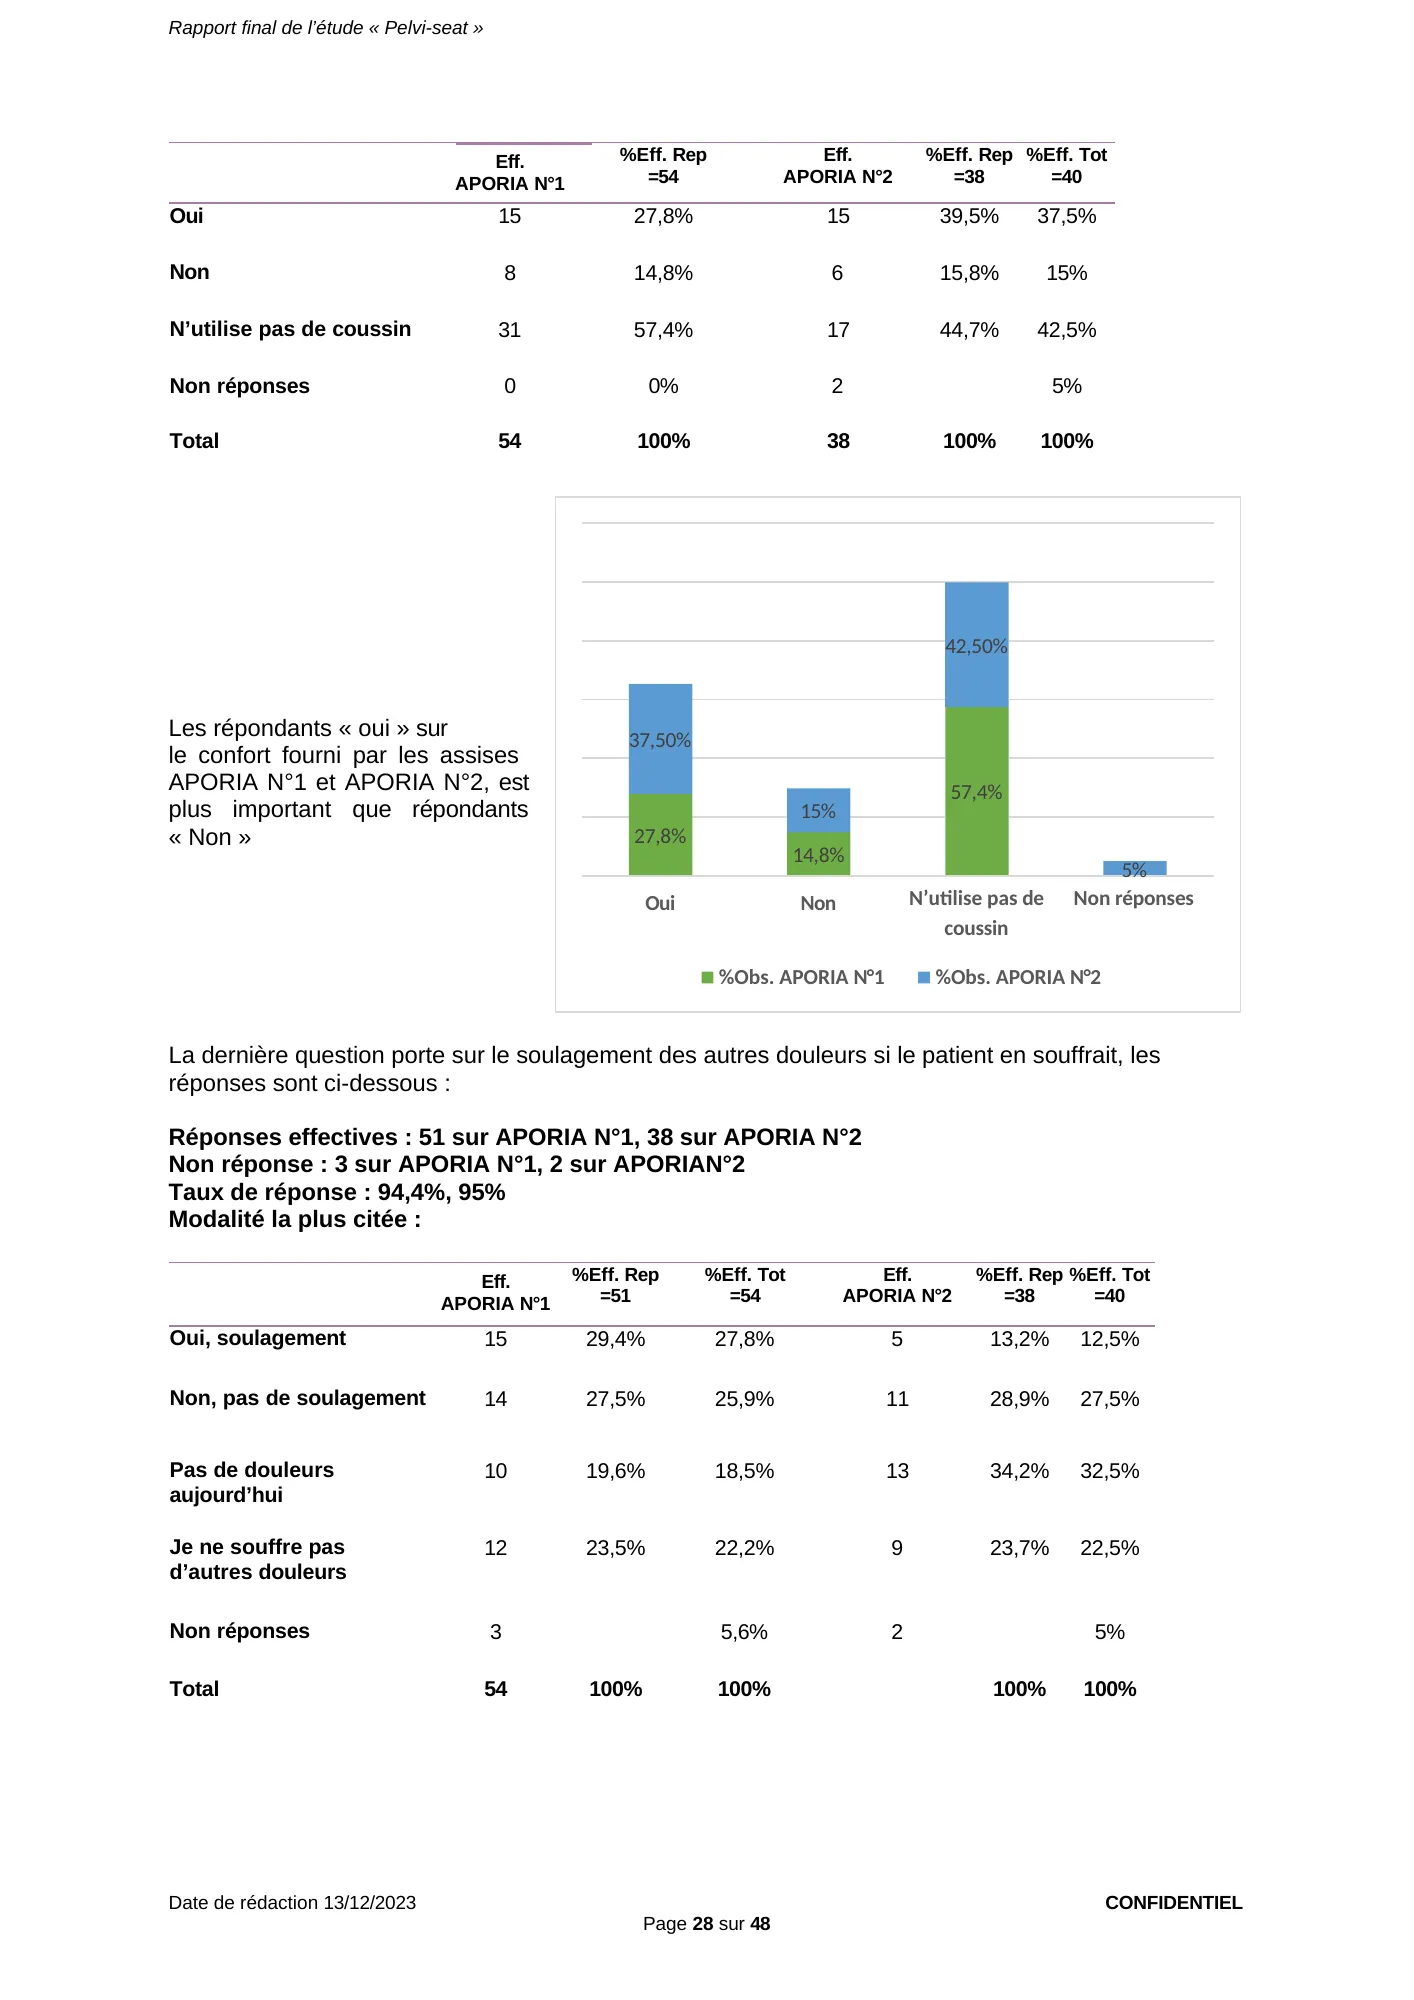
“Yes” answers on the comfort provided by the APORIA N°1 and APORIA N°2 seats outnumber “No” answers
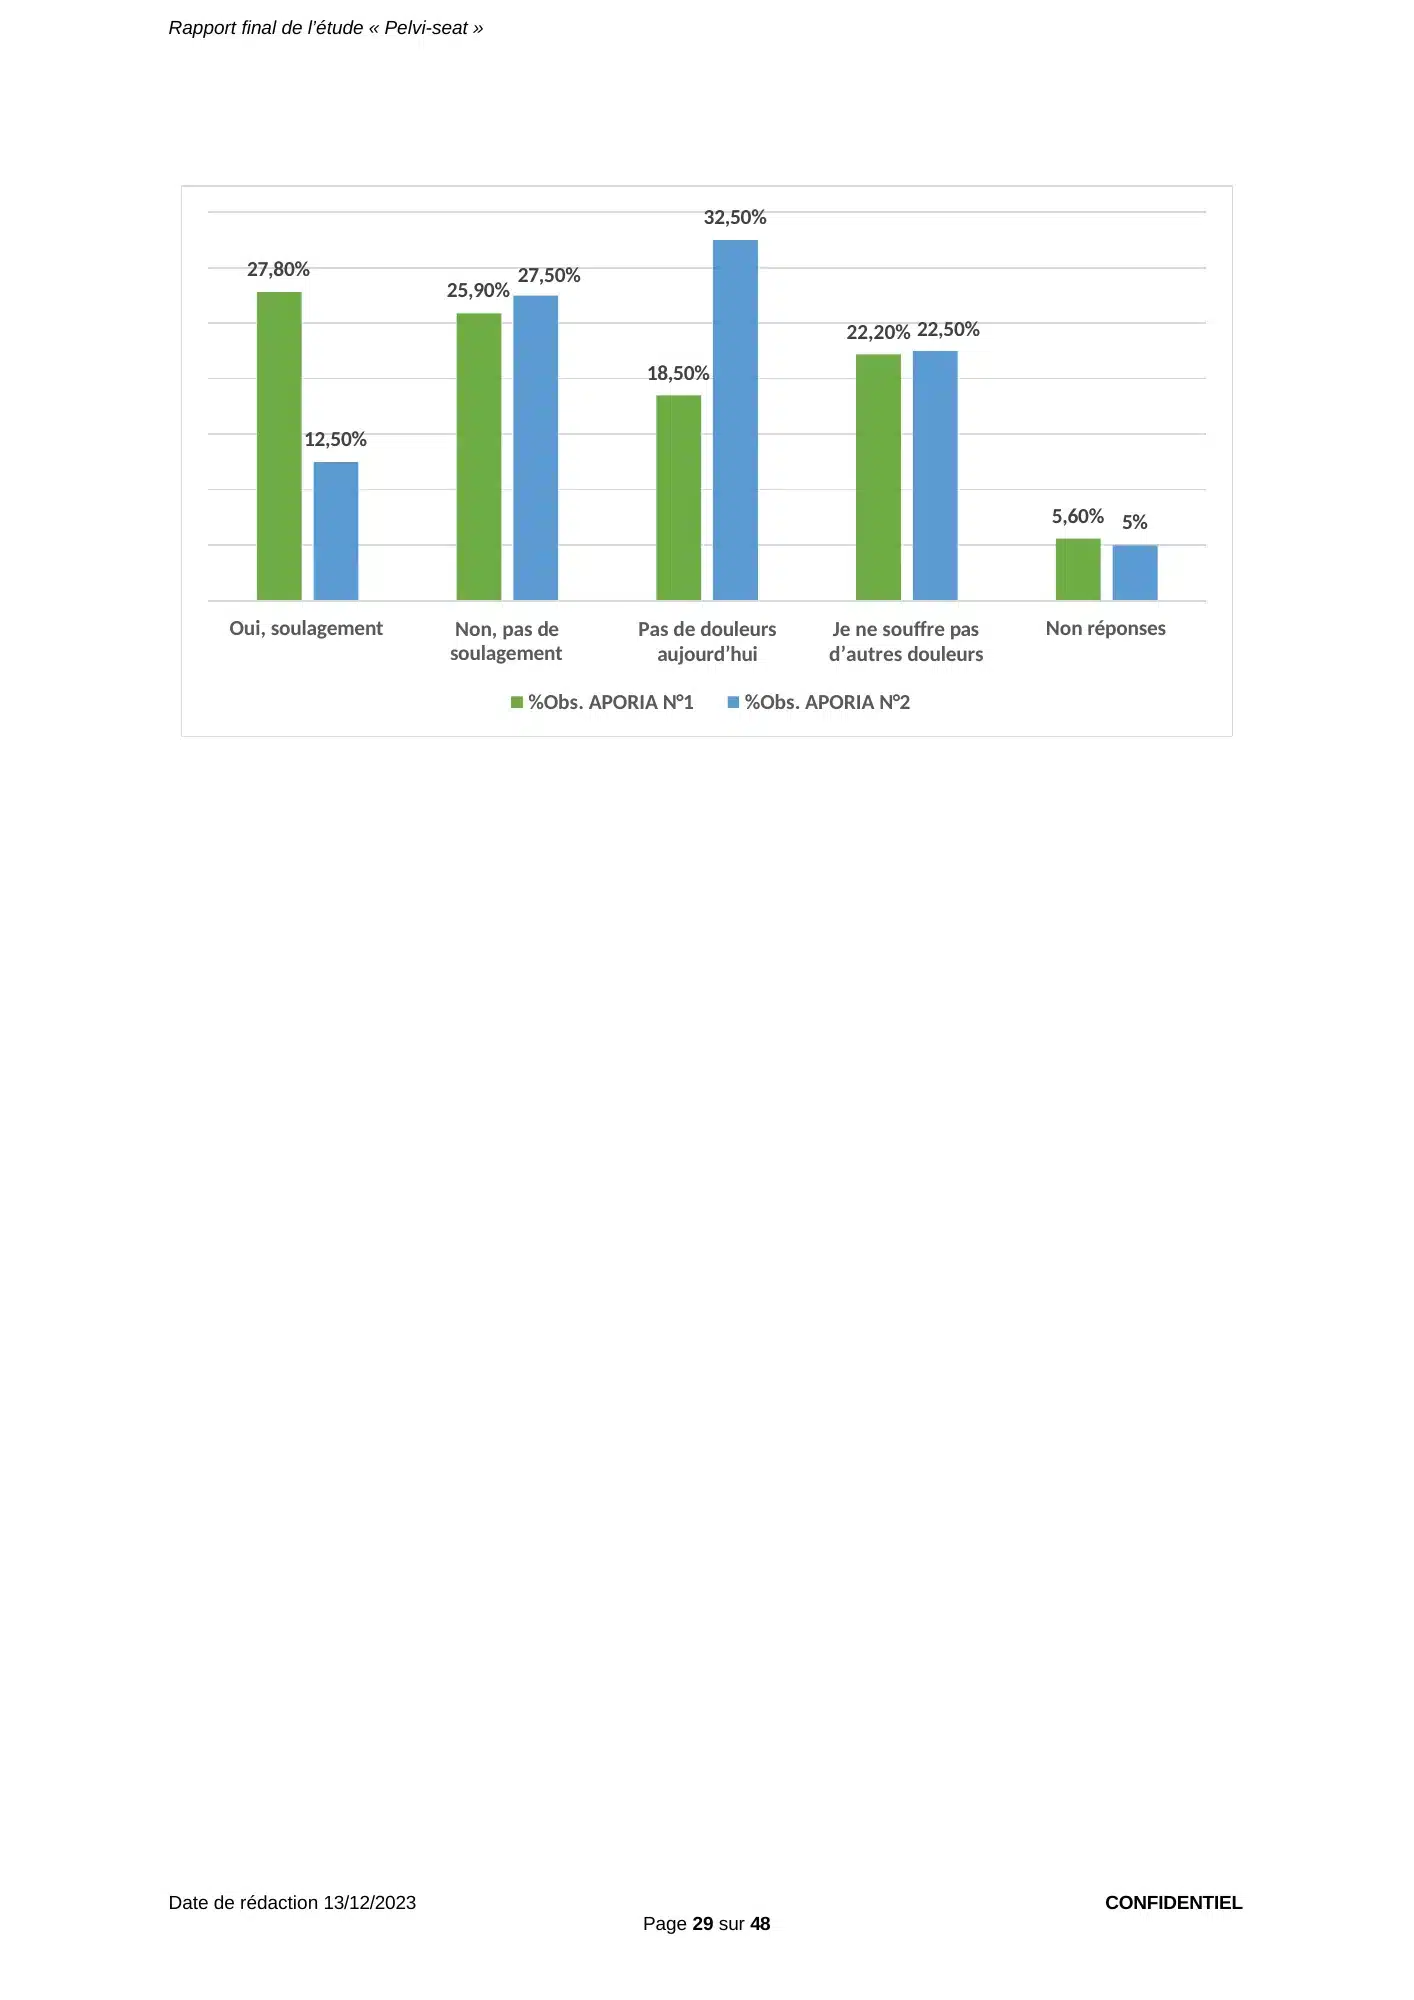
The last question concerns the relief of other pain, if the patient suffered from any; the answers are below:
- Actual responses: 51 for APORIA N°1, 38 for APORIA N°2
- No response: 3 for APORIA N°1, 2 for APORIA N°2
- Response rate: 94.4%, 95%
- Most frequent answer:
| Answer | Eff. APORIA N°1 | %Eff. Rep =51 | %Eff. Tot =54 | Eff. APORIA N°2 | %Eff. Rep =38 | %Eff. Tot =40 |
|---|---|---|---|---|---|---|
| Yes, relief | 15 | 29.4% | 27.8% | 5 | 13.2% | 12.5% |
| No, no relief | 14 | 27.5% | 25.9% | 11 | 28.9% | 27.5% |
| No pain today | 10 | 19.6% | 18.5% | 13 | 34.2% | 32.5% |
| I do not suffer from other pain | 12 | 23.5% | 22.2% | 9 | 23.7% | 22.5% |
| No response | 3 | 5.6% | 2 | 5% | ||
| Total | 54 | 100% | 100% | 100% | 100% |
View the original page (page 28 of the report, in French)
Page 28 — Comfort compared with usual cushions: “yes” for 15 of 54 patients (Aporia® N°1) and 15 of 38 (Aporia® N°2), versus 8 and 6 “no”; relief of other pain.
Report, page 29 of 48 — Relief of other pain (chart), total sample (95 questionnaires)
View the original page (page 29 of the report, in French)
Page 29 — Relief of other pain on Aporia® N°1 and Aporia® N°2 (total sample).
Report, page 30 of 48 — User satisfaction, complete sample (55 questionnaires)
ii. Results for the complete sample (55 questionnaires)
1. User satisfaction
Chair 1: Hard chair
100% of answers on user satisfaction with chair 1 (hard chair) were collected:
- Actual responses: 55
- No response: 0
- Response rate: 100%
- Most frequent answer: Not satisfied
| Chair 1 | Eff.=55 | %Eff. Rep. |
|---|---|---|
| Not satisfied | 22 | 40% |
| Slightly satisfied | 15 | 27.3% |
| Indifferent | 6 | 10.9% |
| Satisfied | 11 | 20% |
| Very satisfied | 1 | 1.8% |
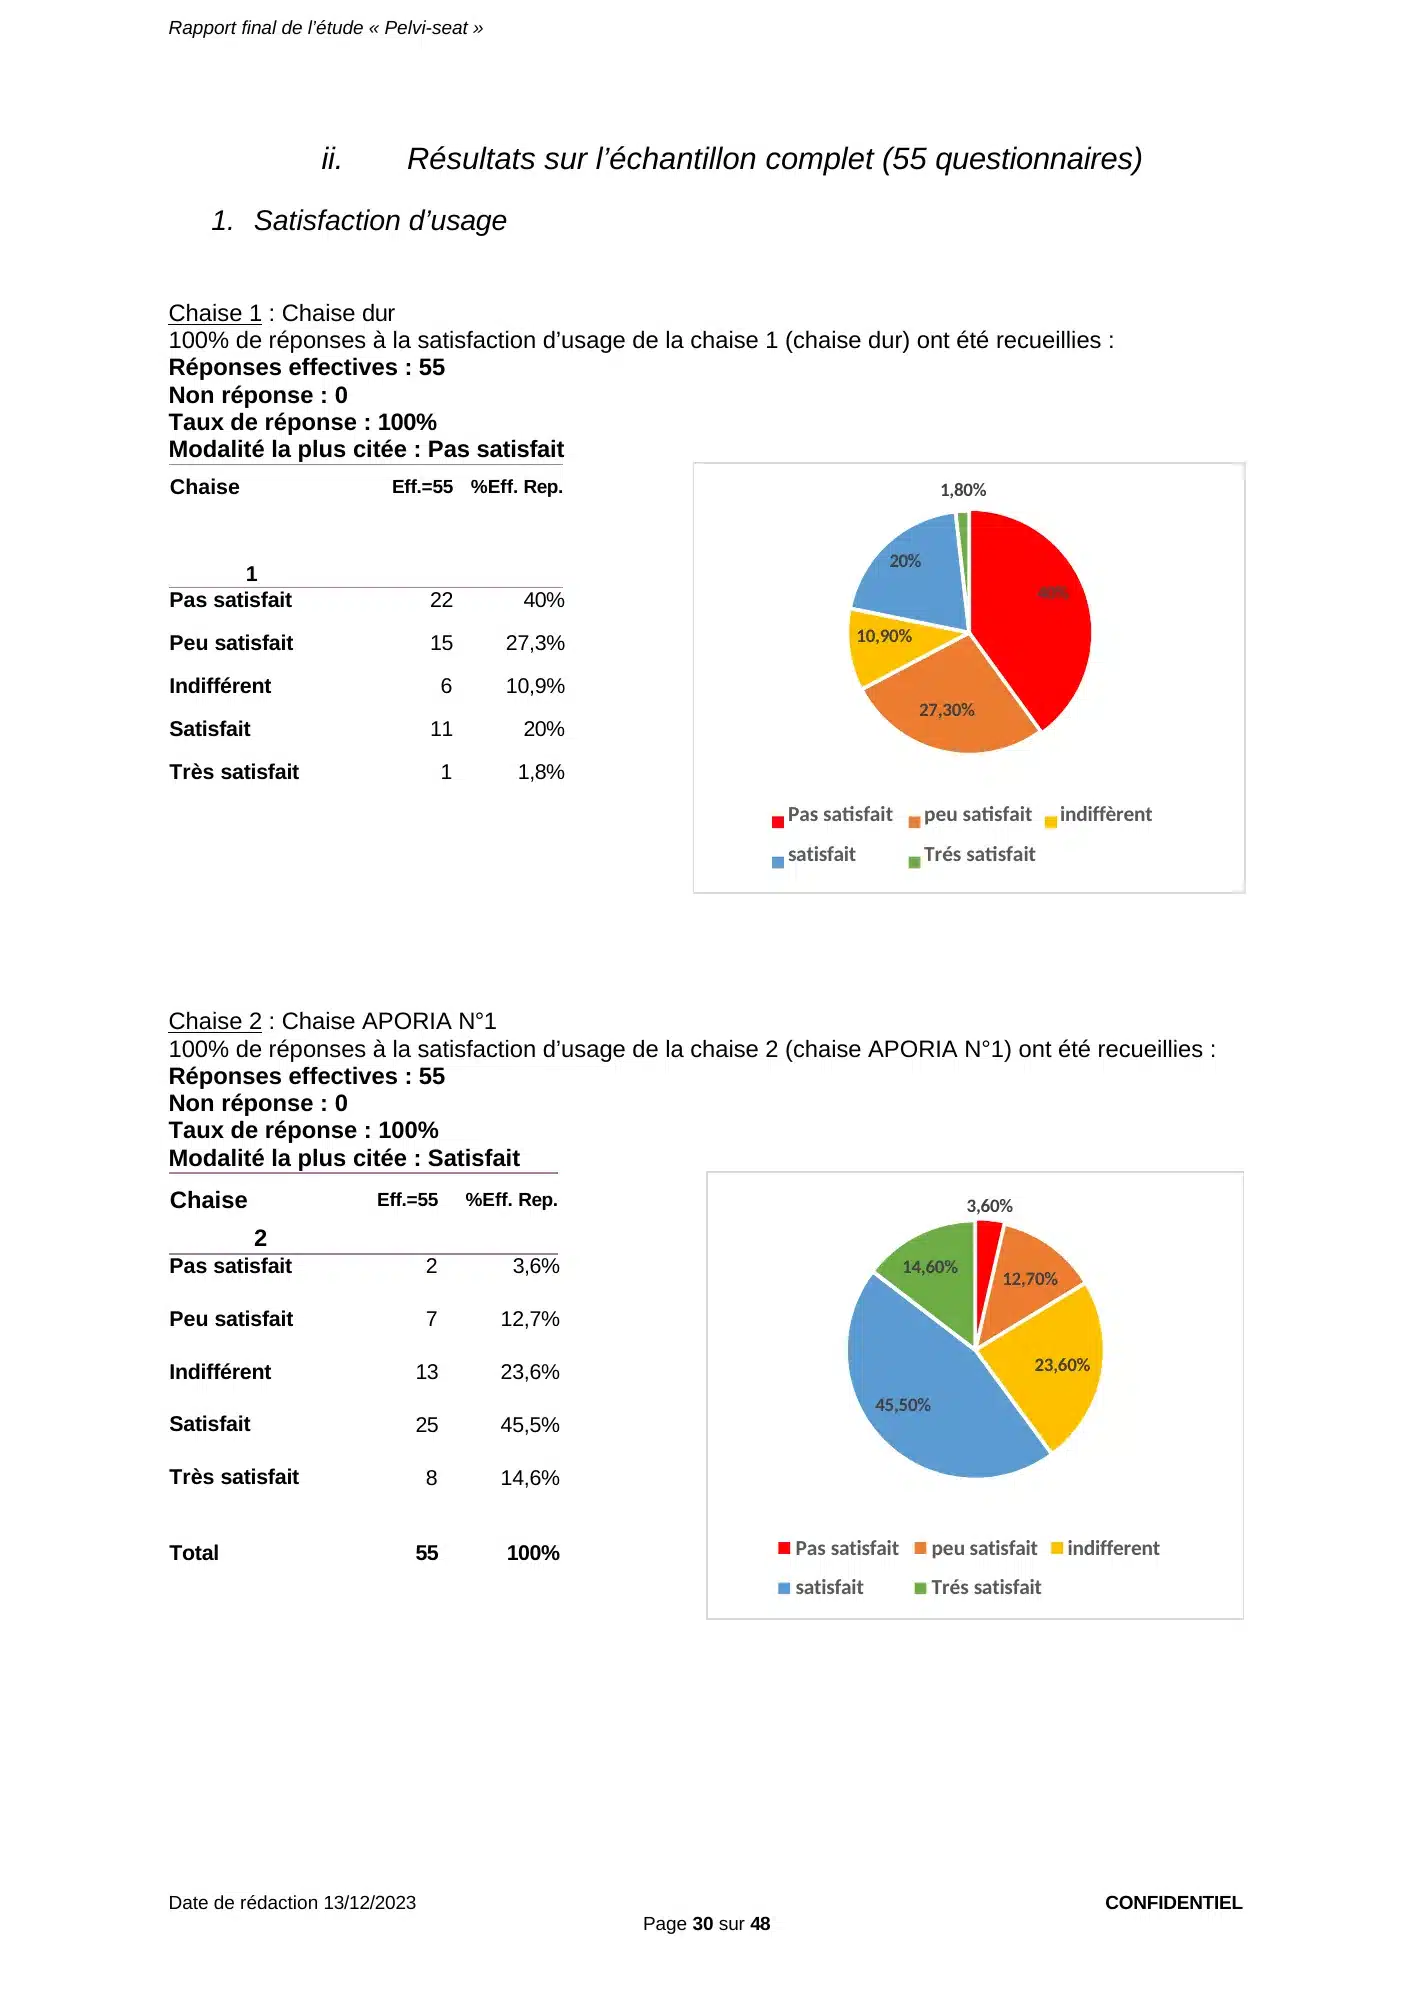
Chair 2: APORIA N°1 chair
100% of answers on user satisfaction with chair 2 (APORIA N°1 chair) were collected:
- Actual responses: 55
- No response: 0
- Response rate: 100%
- Most frequent answer: Satisfied
| Chair 2 | Eff.=55 | %Eff. Rep. |
|---|---|---|
| Not satisfied | 2 | 3.6% |
| Slightly satisfied | 7 | 12.7% |
| Indifferent | 13 | 23.6% |
| Satisfied | 25 | 45.5% |
| Very satisfied | 8 | 14.6% |
| Total | 55 | 100% |
View the original page (page 30 of the report, in French)
Page 30 — Complete sample (55 patients), user satisfaction: hard chair, 22 “not satisfied” (40%); Aporia® N°1, 33 satisfied or very satisfied (60%).
Report, page 31 of 48 — User satisfaction, complete sample (55 questionnaires)
Chair 3: Padded chair
100% of answers on user satisfaction with chair 3 (padded chair) were collected:
- Actual responses: 55
- No response: 0
- Response rate: 100%
- Most frequent answer: Slightly satisfied
| Chair 3 | Eff.=55 | %Eff. Rep |
|---|---|---|
| Not satisfied | 6 | 10.9% |
| Slightly satisfied | 26 | 47.3% |
| Indifferent | 11 | 20% |
| Satisfied | 6 | 10.9% |
| Very satisfied | 6 | 10.9% |
| Total | 55 | 100% |
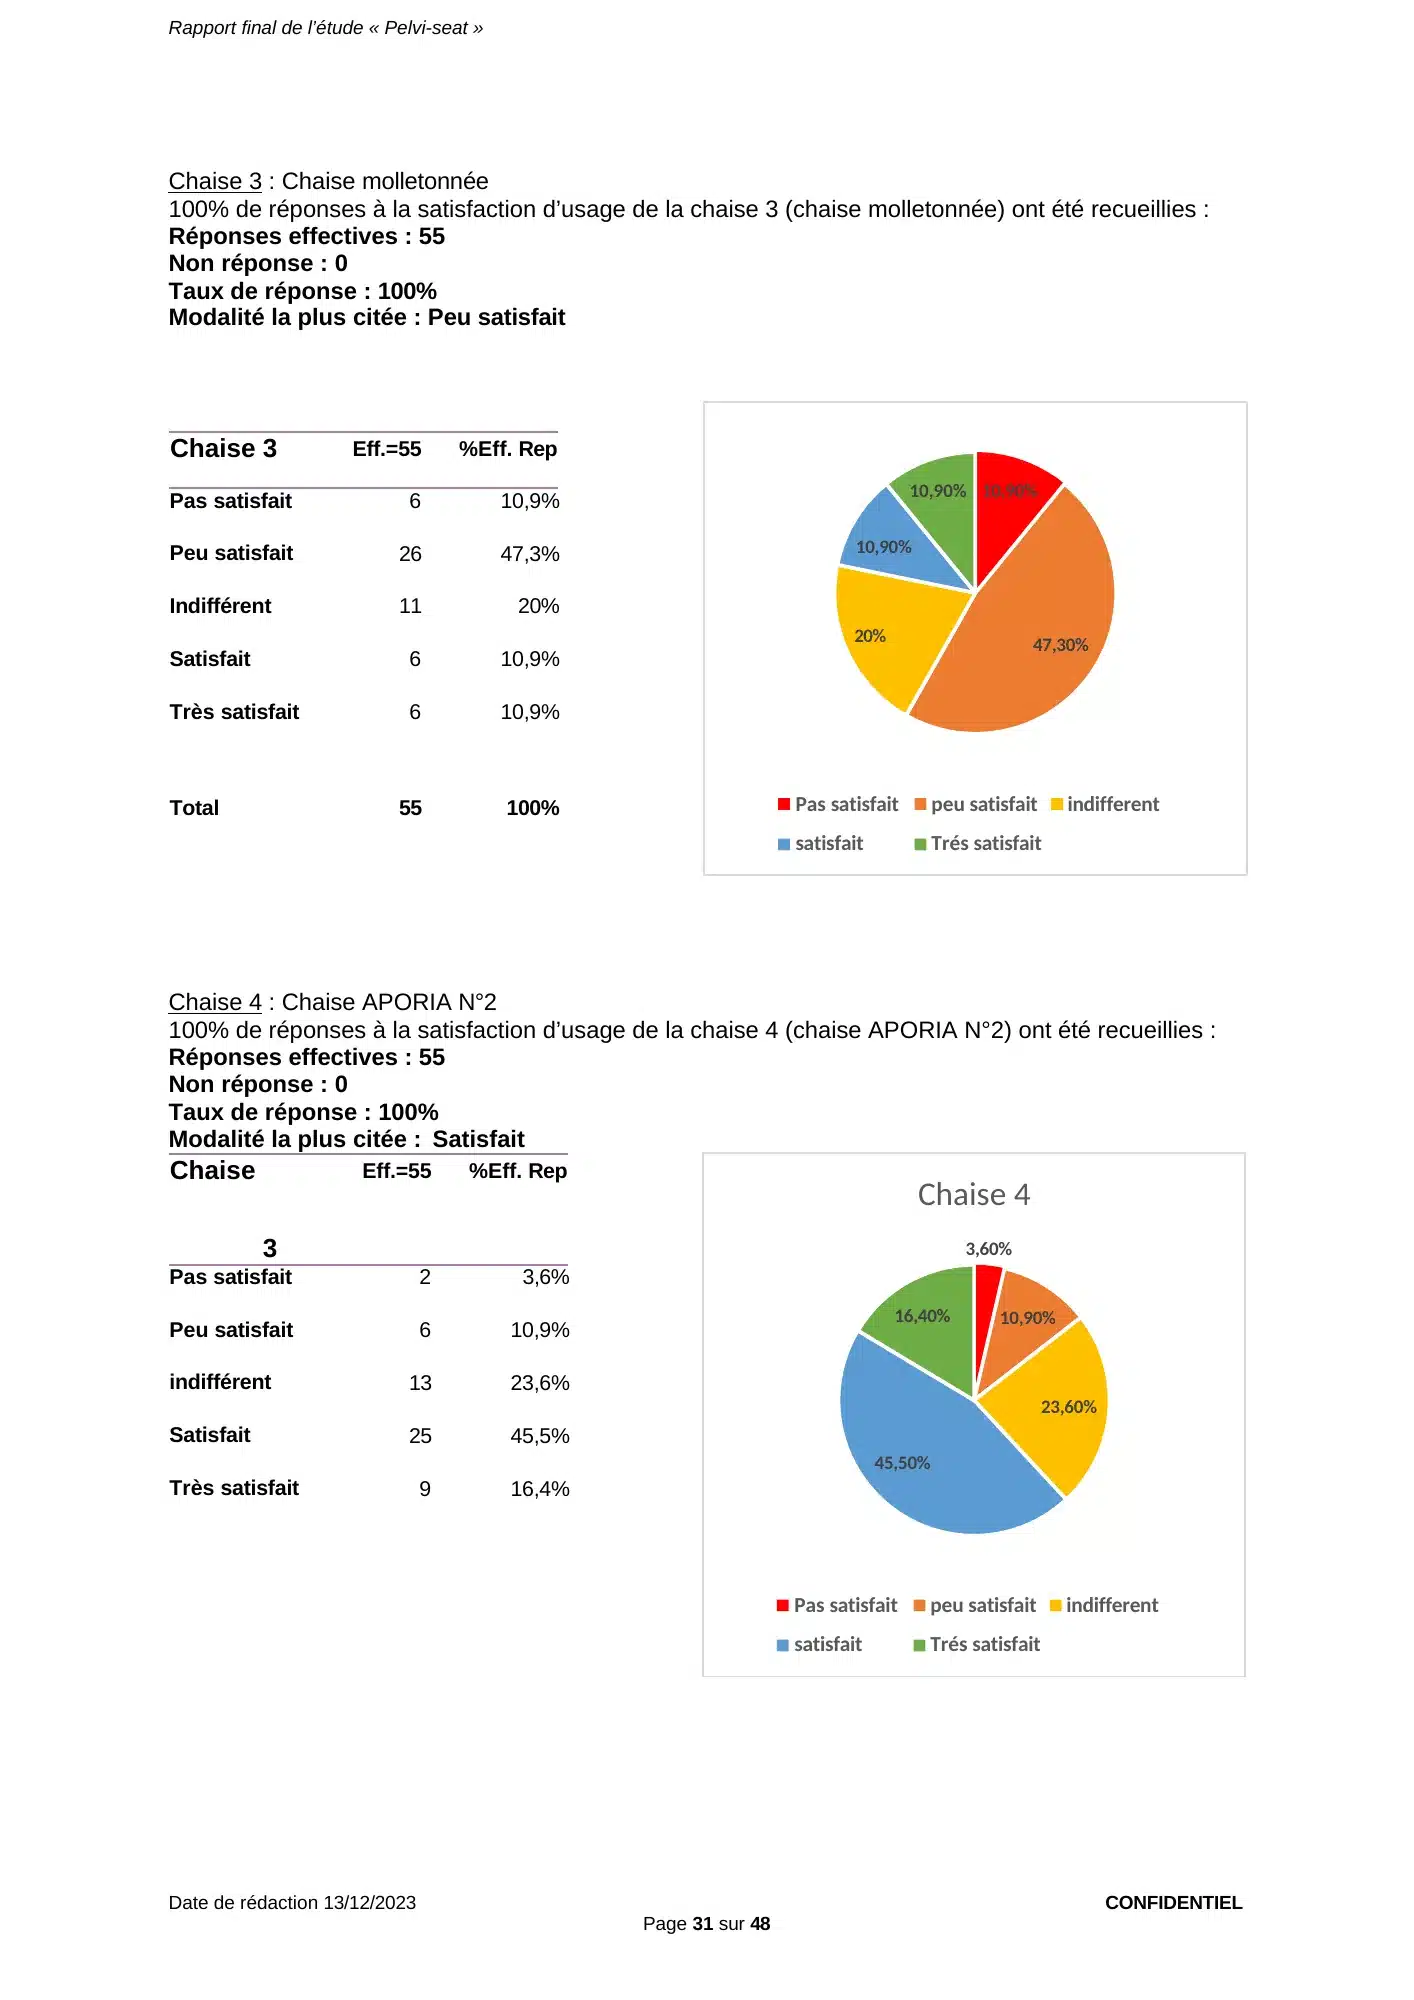
Chair 4: APORIA N°2 chair
100% of answers on user satisfaction with chair 4 (APORIA N°2 chair) were collected:
- Actual responses: 55
- No response: 0
- Response rate: 100%
- Most frequent answer: Satisfied
| Chair 3 | Eff.=55 | %Eff. Rep |
|---|---|---|
| Not satisfied | 2 | 3.6% |
| Slightly satisfied | 6 | 10.9% |
| Indifferent | 13 | 23.6% |
| Satisfied | 25 | 45.5% |
| Very satisfied | 9 | 16.4% |
View the original page (page 31 of the report, in French)
Page 31 — Complete sample (55 patients), user satisfaction: padded chair, 26 “slightly satisfied” (47.3%); Aporia® N°2, 34 satisfied or very satisfied (61.8%).
Report, page 32 of 48 — Summary of user satisfaction, complete sample (55 questionnaires)
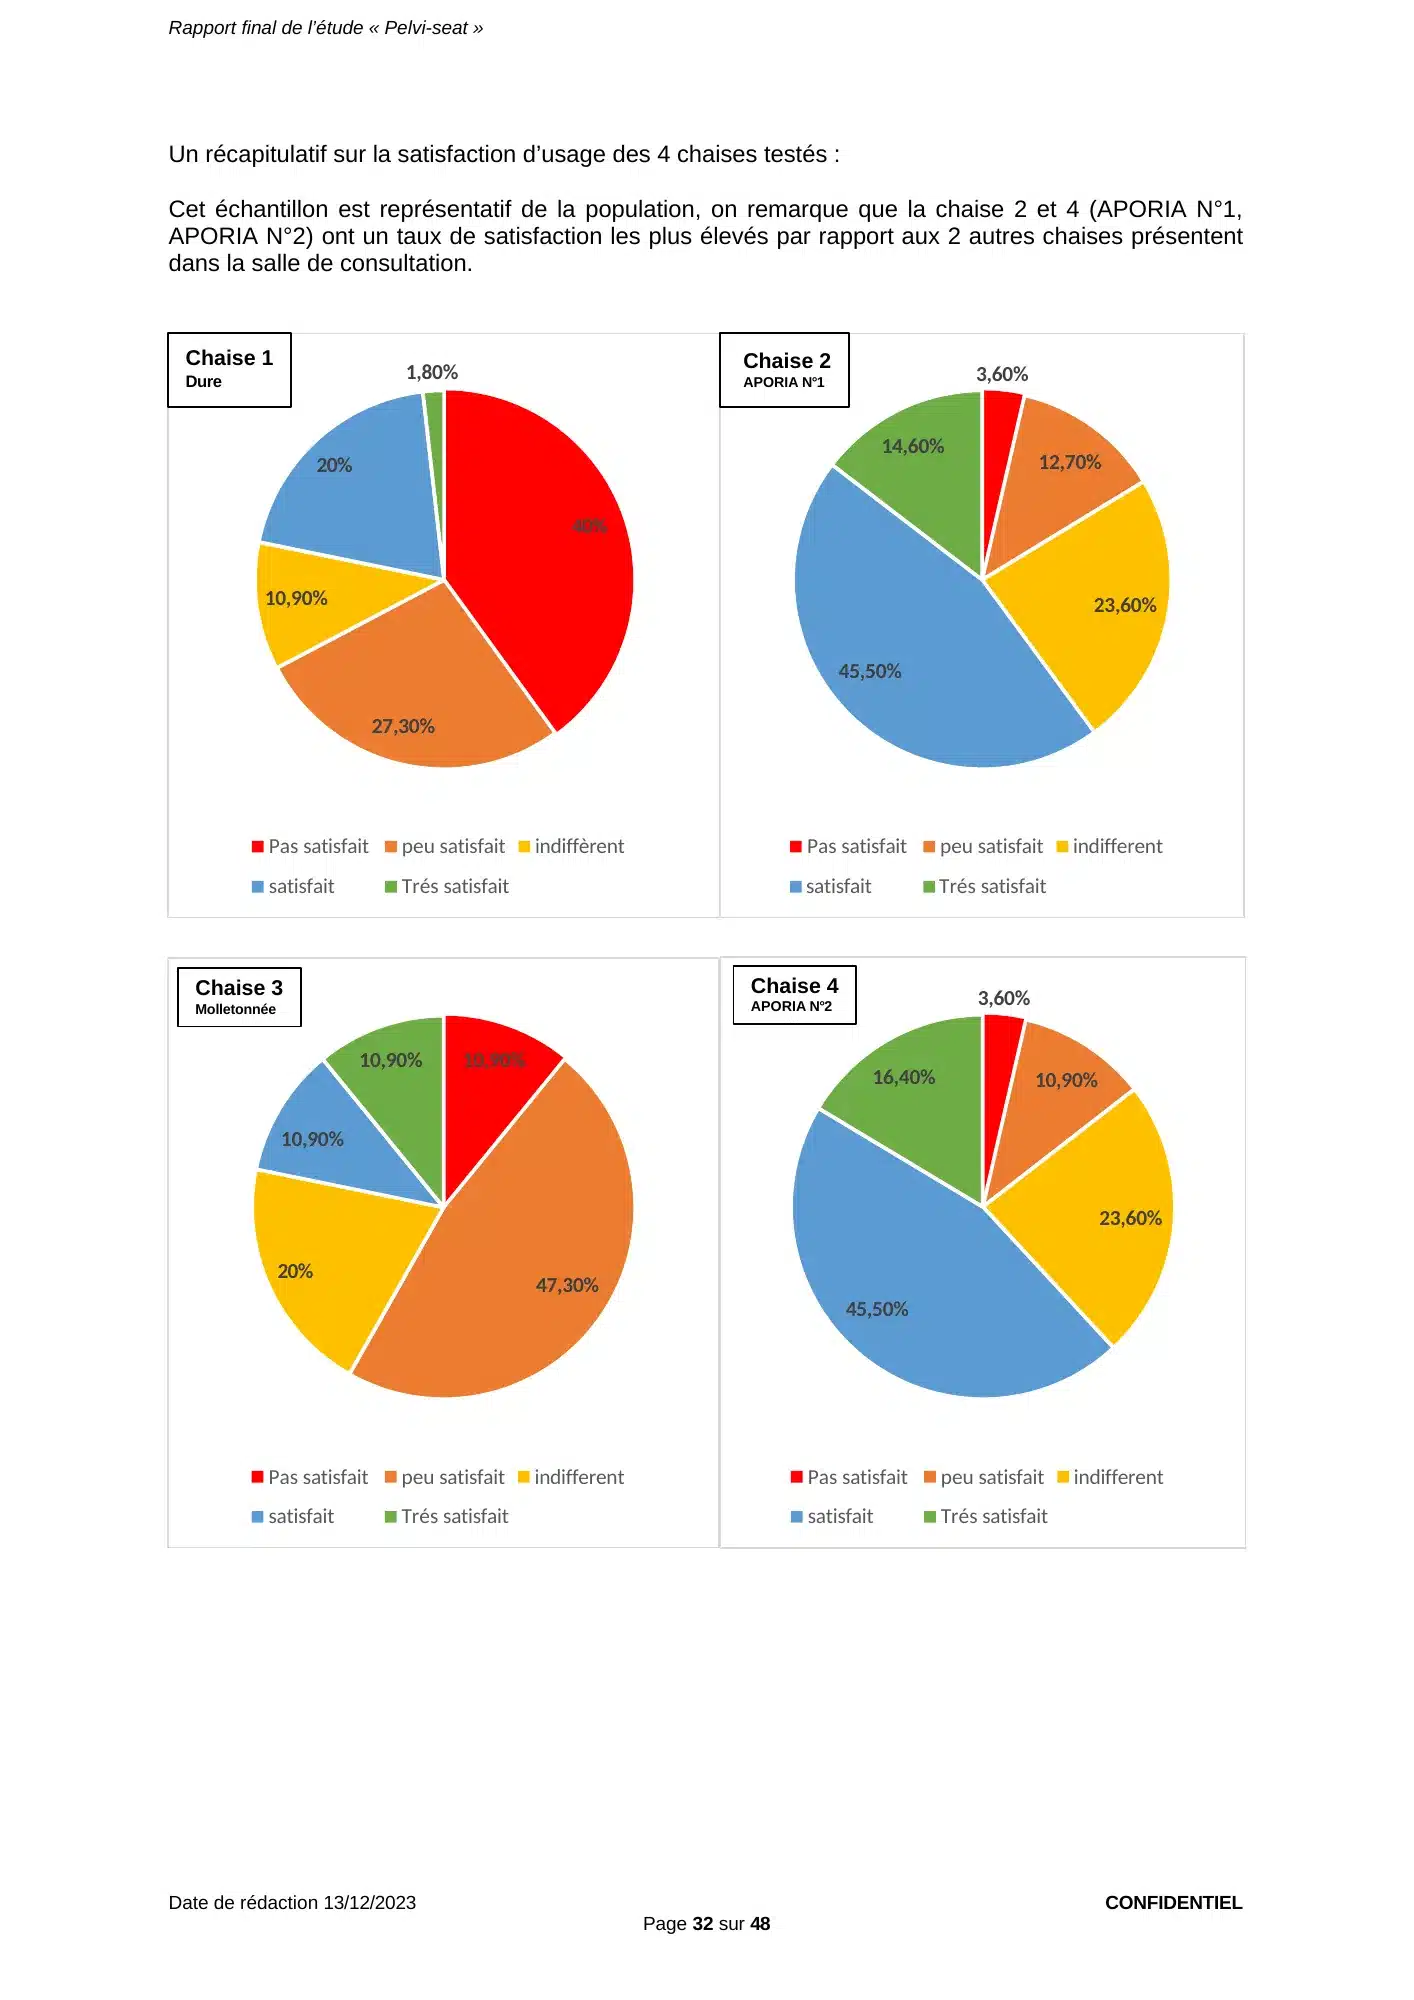
Summary of user satisfaction for the 4 chairs tested:
This sample is representative of the population; chairs 2 and 4 (APORIA N°1, APORIA N°2) have the highest satisfaction rates compared with the other 2 chairs in the waiting room.
View the original page (page 32 of the report, in French)
Page 32 — Summary of satisfaction, complete sample: the Aporia® N°1 and N°2 seats have the highest satisfaction rates.
Report, page 33 of 48 — Pain while seated, complete sample (55 questionnaires)
2. Pain while seated
Chair 1: Hard chair
100% of answers on the presence or absence of pain after sitting for 2 minutes on the hard chair were collected:
- Actual responses: 55
- No response: 0
- Response rate: 100%
- Most frequent answer: Pain, but able to remain seated
| Chair 1 | Eff.=55 | %Eff. Rep. |
|---|---|---|
| No pain | 13 | 23.6% |
| Pain, but able to remain seated | 24 | 43.7% |
| Pain forcing the patient to get up | 18 | 32.7% |
| Total | 55 | 100% |
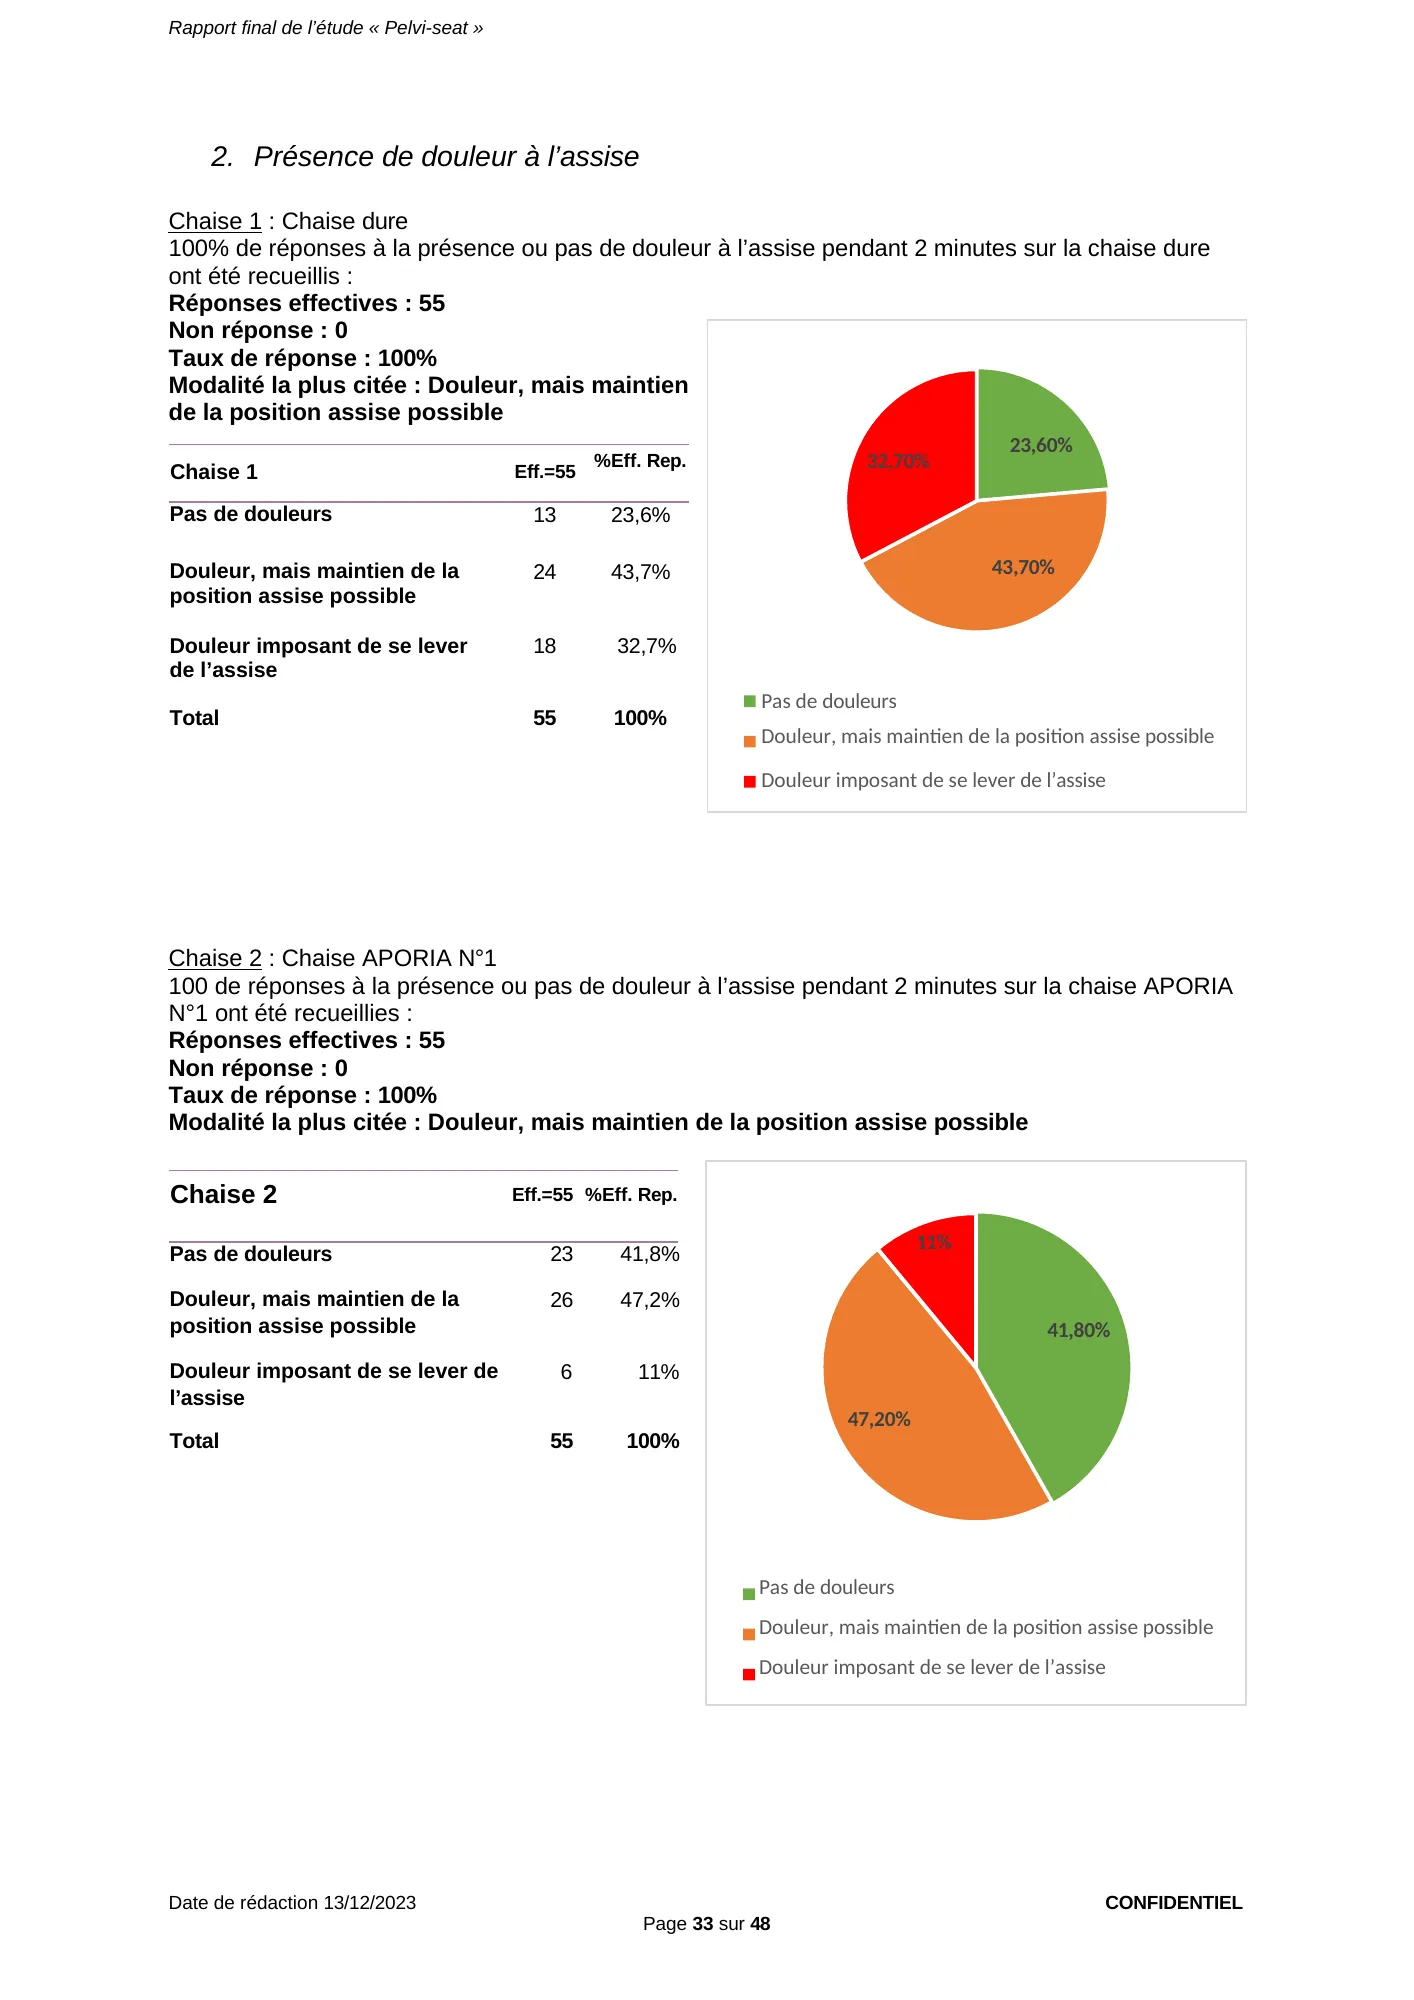
Chair 2: APORIA N°1 chair
100 of answers on the presence or absence of pain after sitting for 2 minutes on the APORIA N°1 chair were collected:
- Actual responses: 55
- No response: 0
- Response rate: 100%
- Most frequent answer: Pain, but able to remain seated
| Chair 2 | Eff.=55 | %Eff. Rep. |
|---|---|---|
| No pain | 23 | 41.8% |
| Pain, but able to remain seated | 26 | 47.2% |
| Pain forcing the patient to get up | 6 | 11% |
| Total | 55 | 100% |
View the original page (page 33 of the report, in French)
Page 33 — Pain after 2 minutes seated, complete sample (55 patients): 18 have to get up from the hard chair (32.7%), versus 6 on the Aporia® N°1 (11%), where 23 have no pain.
Report, page 34 of 48 — Pain while seated, complete sample (55 questionnaires)
Chair 3: Padded chair
100% of answers on the presence or absence of pain after sitting for 2 minutes on the padded chair were collected:
- Actual responses: 55
- No response: 0
- Response rate: 100%
- Most frequent answer: Pain, but able to remain seated
| Chair 3 | Eff.=55 | %Eff. Rep |
|---|---|---|
| No pain | 13 | 23.6% |
| Pain, but able to remain seated | 24 | 43.6% |
| Pain forcing the patient to get up | 18 | 32.8% |
| Total | 55 | 100% |
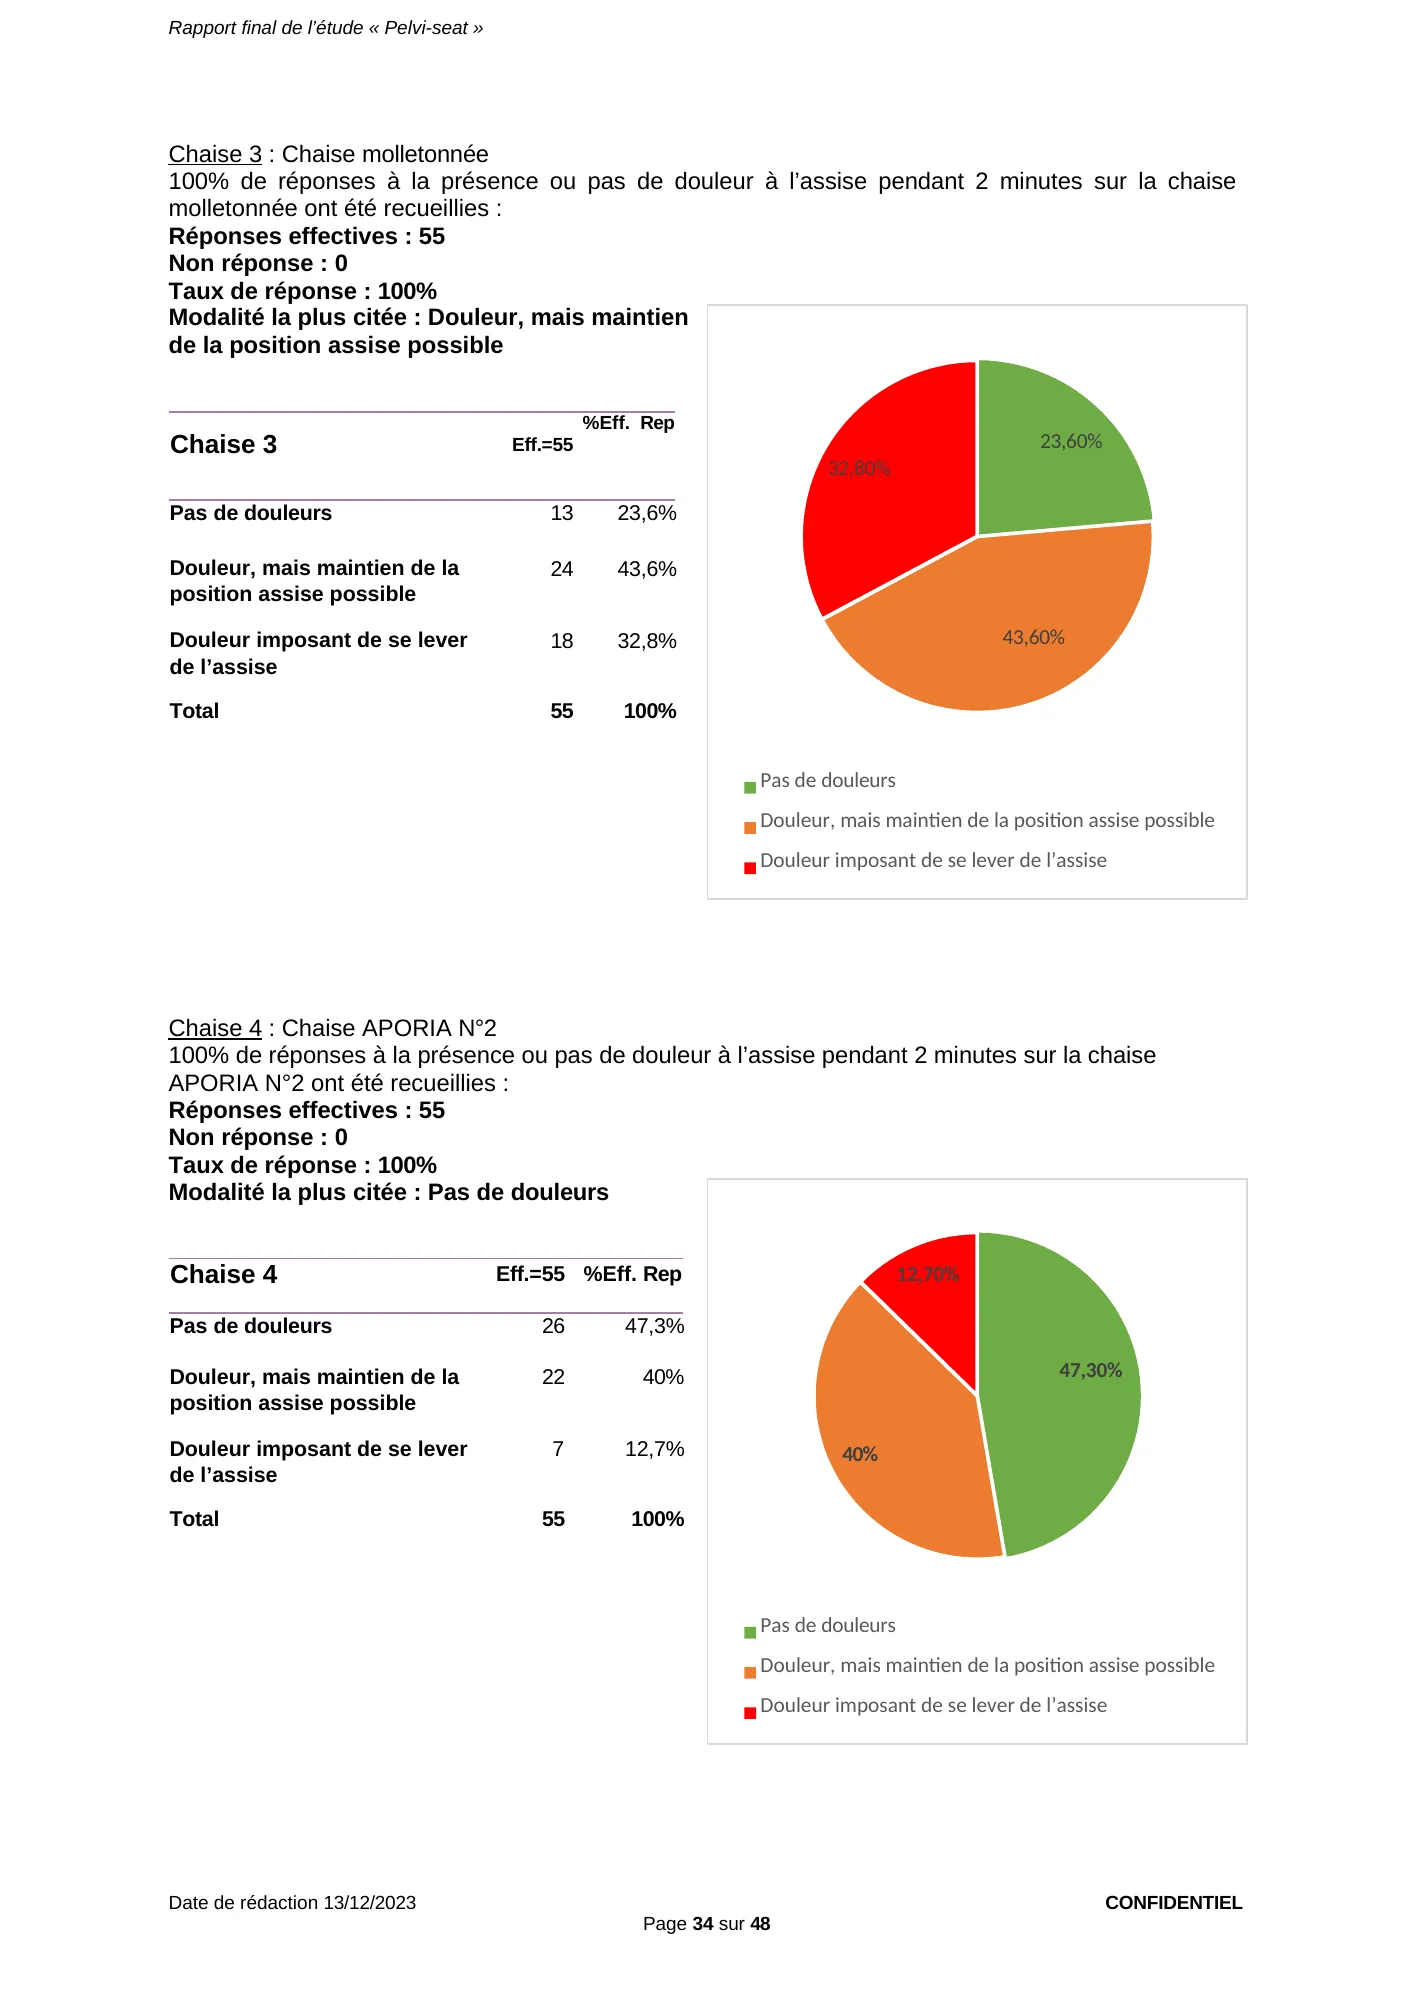
Chair 4: APORIA N°2 chair
100% of answers on the presence or absence of pain after sitting for 2 minutes on the APORIA N°2 chair were collected:
- Actual responses: 55
- No response: 0
- Response rate: 100%
- Most frequent answer: No pain
| Chair 4 | Eff.=55 | %Eff. Rep |
|---|---|---|
| No pain | 26 | 47.3% |
| Pain, but able to remain seated | 22 | 40% |
| Pain forcing the patient to get up | 7 | 12.7% |
| Total | 55 | 100% |
View the original page (page 34 of the report, in French)
Page 34 — Pain after 2 minutes seated, complete sample (55 patients): padded chair, 18 have to get up (32.8%); Aporia® N°2, 26 patients without pain (47.3%).
Report, page 35 of 48 — Summary of pain while seated, complete sample (55 questionnaires)
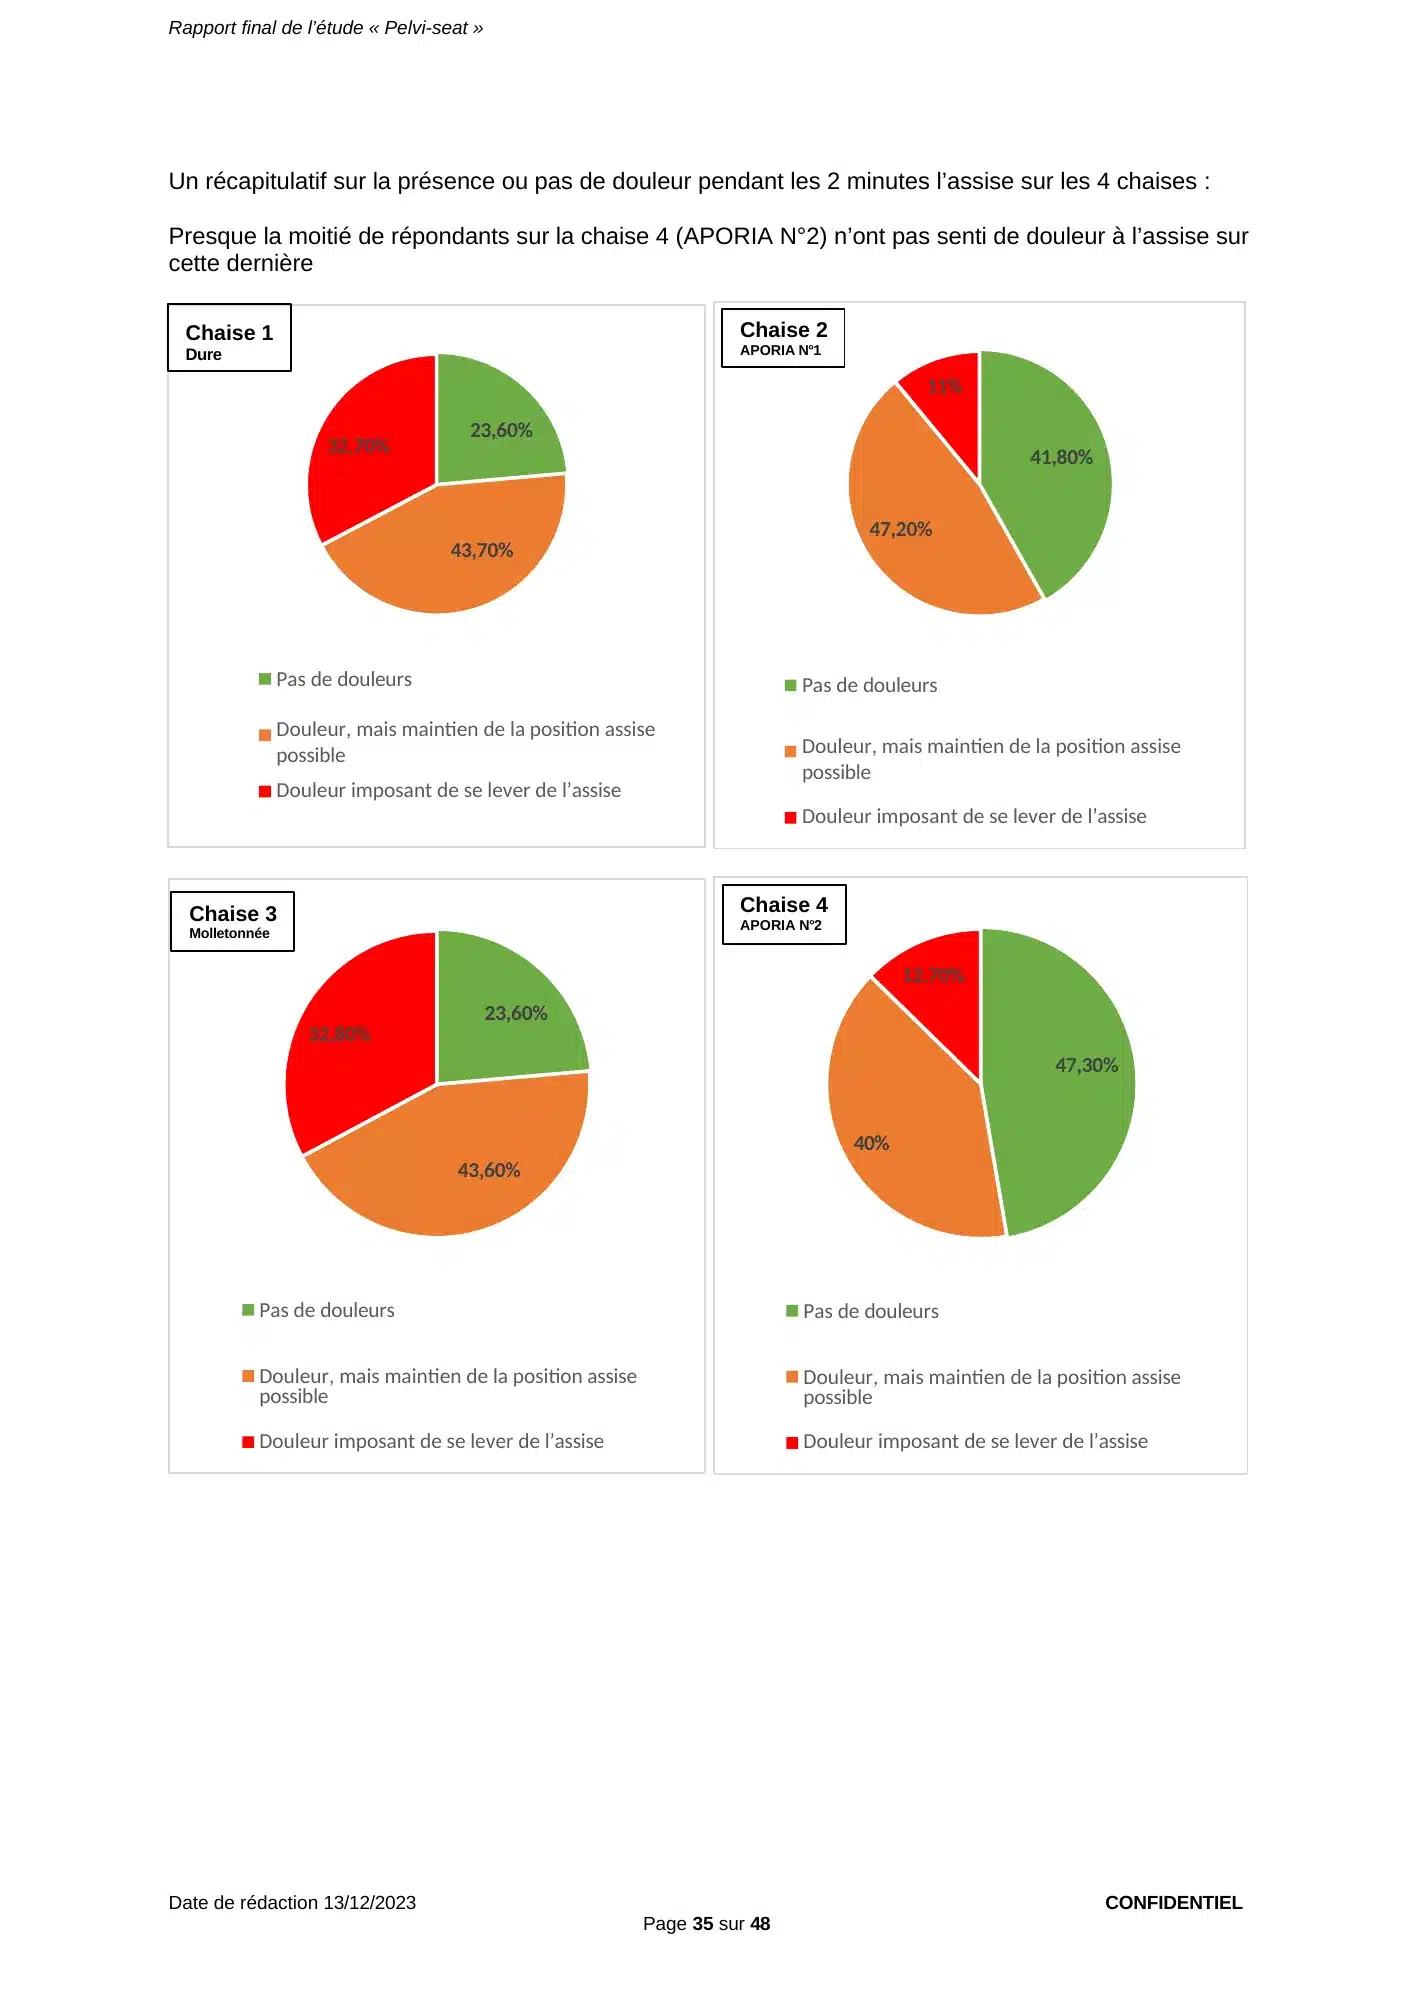
Summary of the presence or absence of pain during the 2 minutes seated on the 4 chairs:
Almost half of the respondents on chair 4 (APORIA N°2) felt no pain while seated on it
View the original page (page 35 of the report, in French)
Page 35 — Summary of pain while seated: almost half of the patients felt no pain on the Aporia® N°2.
Report, page 36 of 48 — Results for the complete sample (55 questionnaires)
3. Order of preference
100% of answers on the order of the 4 chairs from most preferred to least preferred were collected:
- Actual responses: 55
- No response: 0
- Response rate: 100%
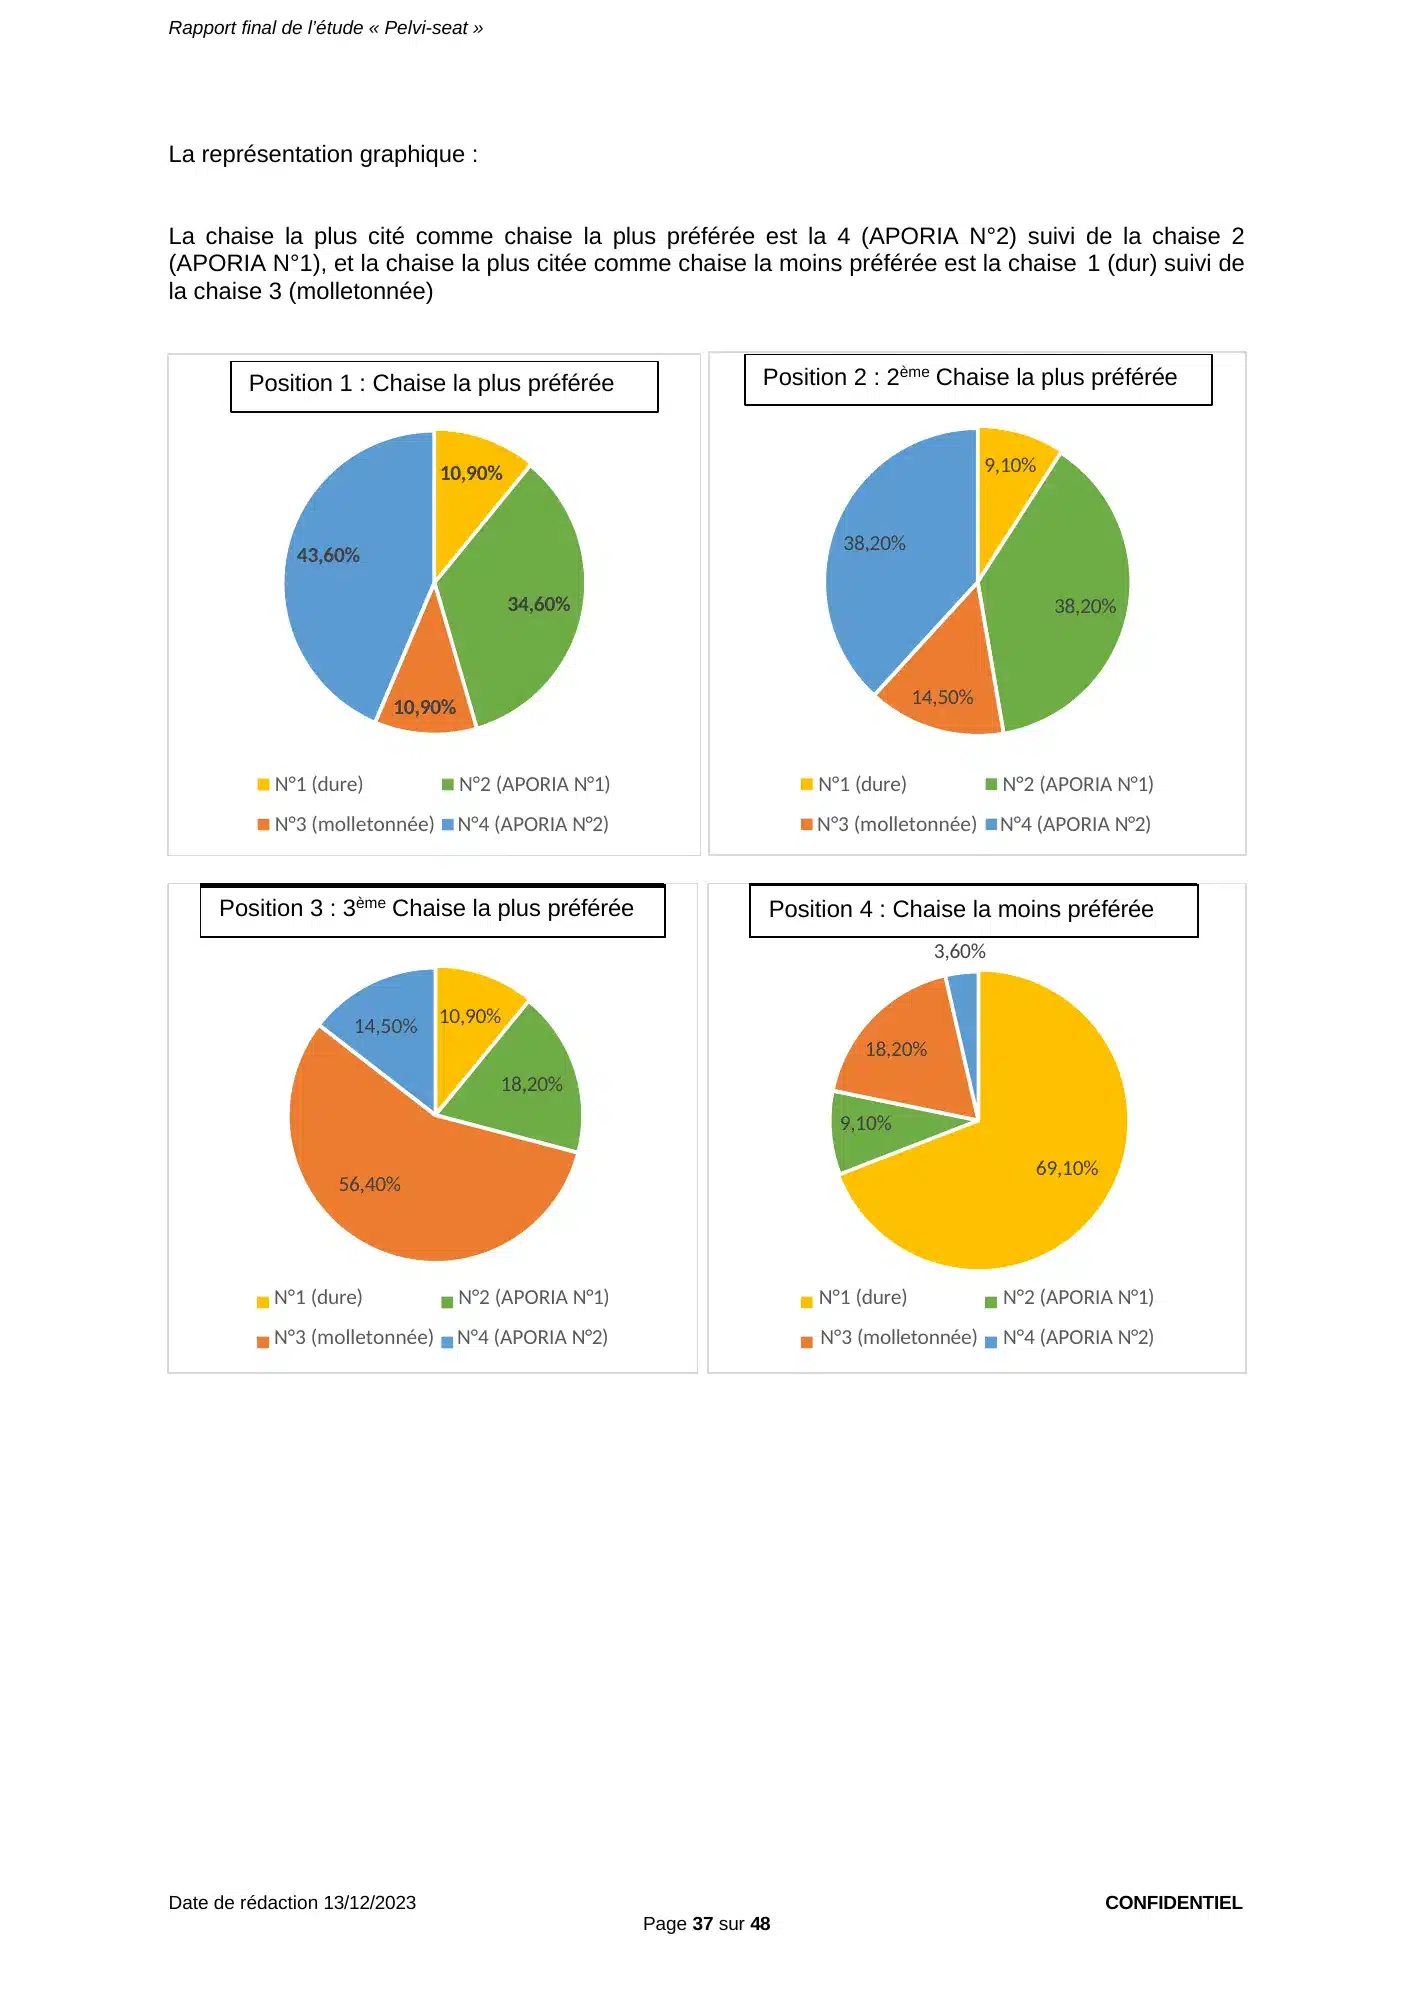
| Chair | 1st most preferred chair Eff. | %Eff. Rep. | 2nd most preferred chair Eff. | %Eff. Rep. |
|---|---|---|---|---|
| N°1 (hard) | 6 | 10.9% | 5 | 9.1% |
| N°2 (APORIA N°1) | 19 | 34.6% | 21 | 38.2% |
| N°3 (padded) | 6 | 10.9% | 8 | 14.5% |
| N°4 (APORIA N°2) | 24 | 43.6% | 21 | 38.2% |
| Total | 55 | 100% | 55 | 100% |
| Chair | 3rd most preferred chair Eff. | %Eff. Rep. | Least preferred chair Eff. | %Eff. Rep. |
|---|---|---|---|---|
| N°1 (hard) | 6 | 10.9% | 38 | 69.1% |
| N°2 (APORIA N°1) | 10 | 18.2% | 5 | 9.1% |
| N°3 (padded) | 31 | 56.4% | 10 | 18.2% |
| N°4 (APORIA N°2) | 8 | 14.5% | 2 | 3.6% |
| Total | 55 | 100% | 55 | 100% |
View the original page (page 36 of the report, in French)
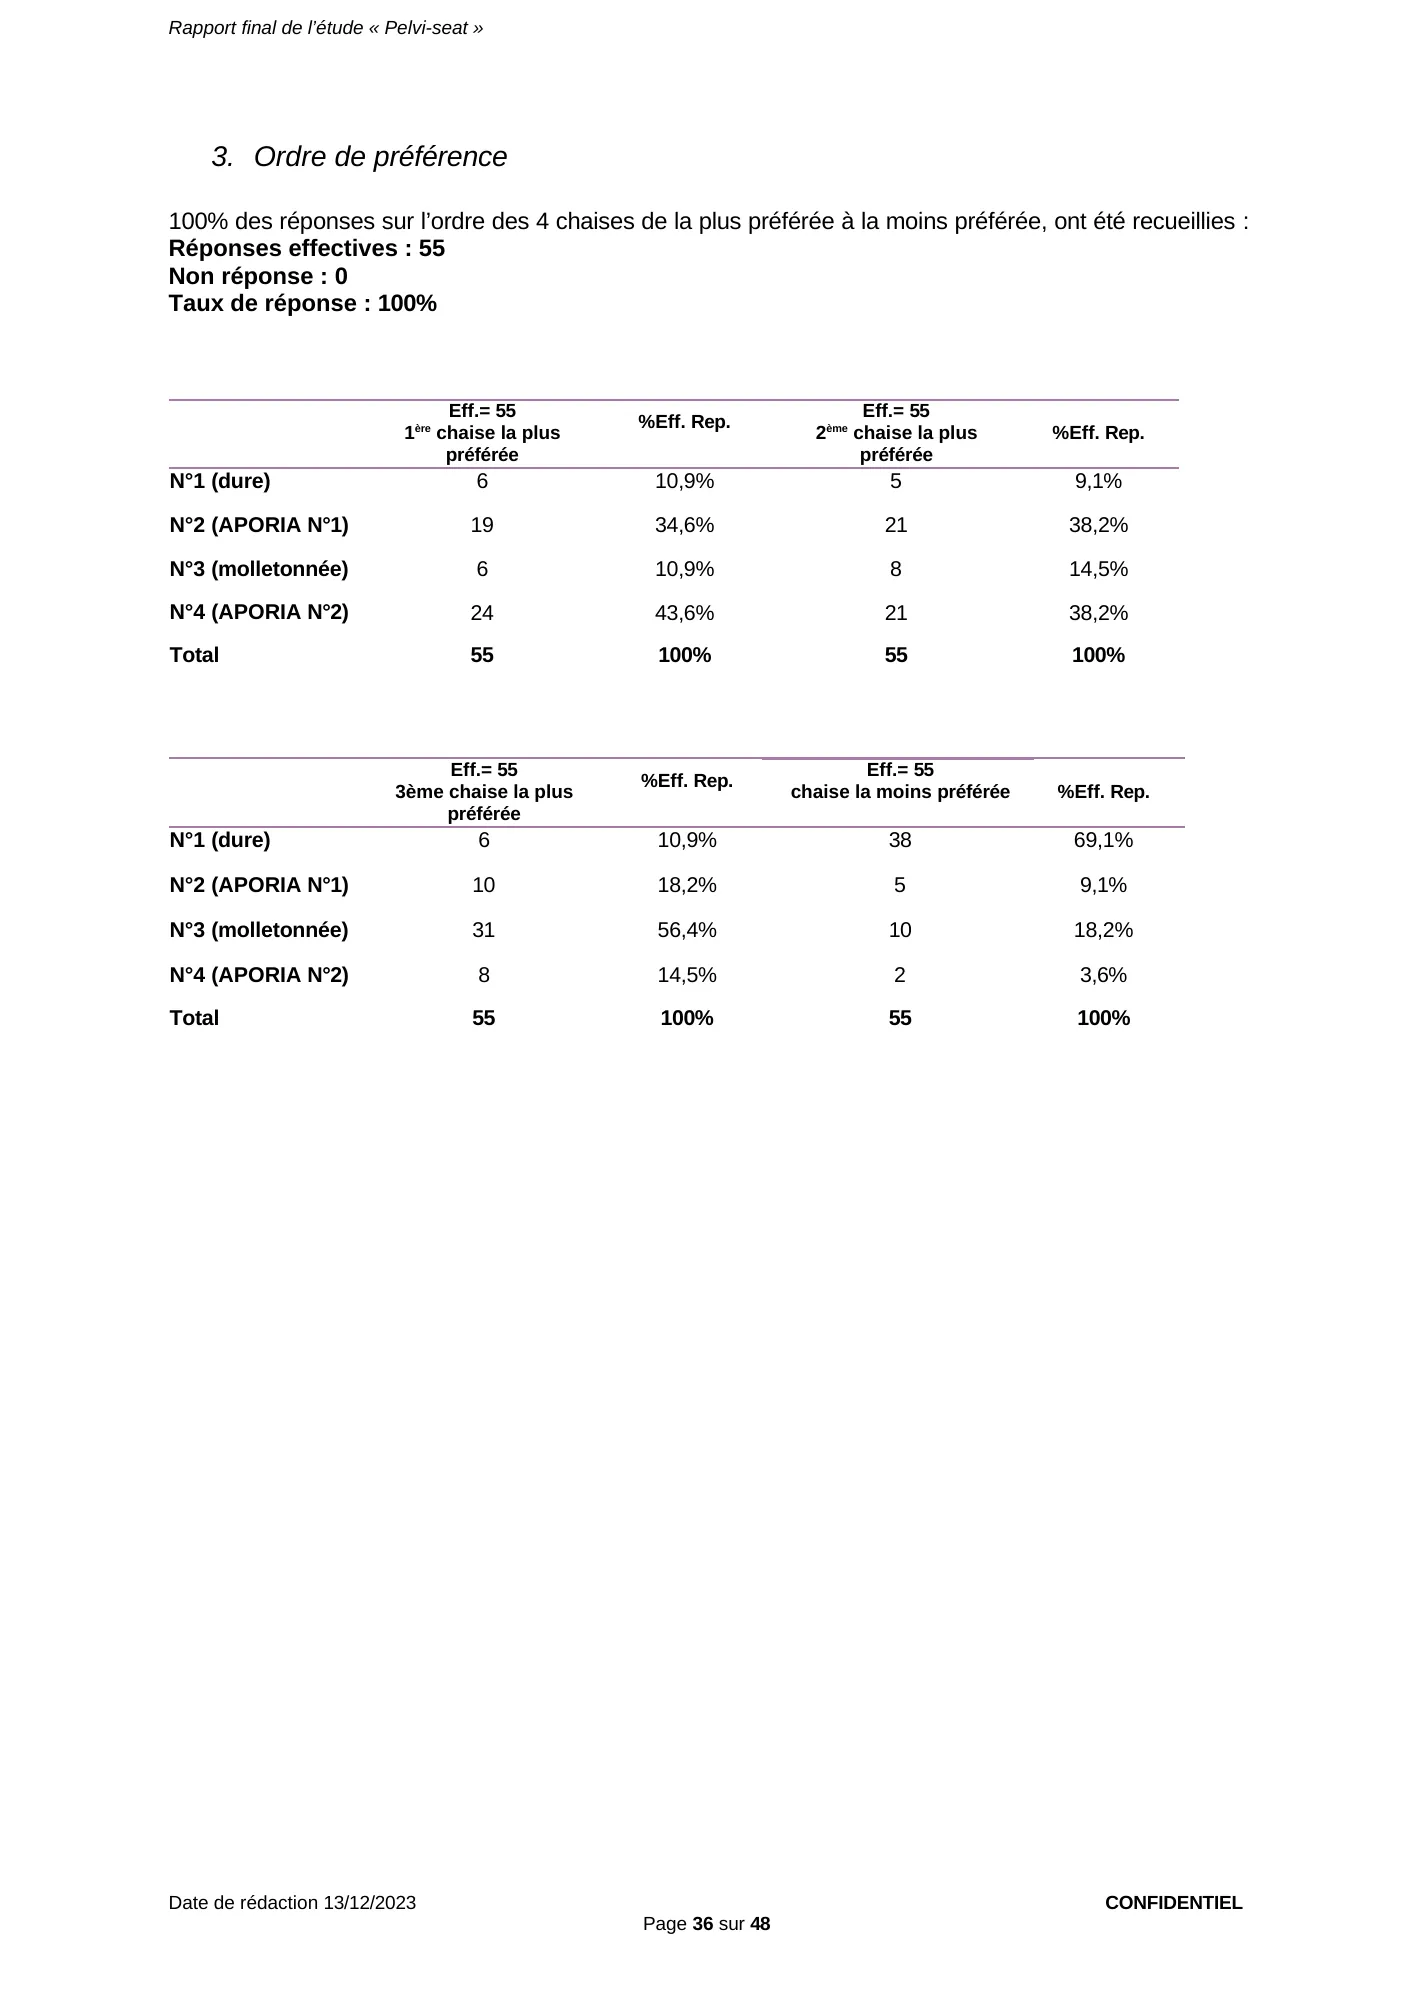
Page 36 — Order of preference, complete sample (55 patients): Aporia® N°2 ranked first by 24 patients (43.6%), Aporia® N°1 by 19 (34.6%), hard chair and padded chair by 6 each (10.9%); hard chair ranked last by 38 patients (69.1%).
Report, page 37 of 48 — Results for the complete sample (55 questionnaires)
Charts:
The chair most often cited as most preferred is chair 4 (APORIA N°2), followed by chair 2 (APORIA N°1), and the chair most often cited as least preferred is chair 1 (hard), followed by chair 3 (padded)
View the original page (page 37 of the report, in French)
Page 37 — Charts of the order of preference (55 patients): Aporia® N°2 then Aporia® N°1 most often ranked first; hard chair then padded chair most often ranked last.
Report, page 38 of 48 — Results for the complete sample (55 questionnaires)
Answers on the criteria chosen to rank the seats from most to least preferred were collected:
- Actual responses: 55
- No response: 0
- Response rate: 100%
- Most frequent answer: Pain relief
Note: this is a multiple-choice question, i.e. the patient can tick one or more answers.
| Criterion | Eff. =55 | %Eff. Rep |
|---|---|---|
| Ergonomics (shape, consistency…) | 22 | 40% |
| Postural support (lumbar support, accompanying movements) | 26 | 47.3% |
| Relief of any pain | 46 | 83.6% |
| Total | 55 |
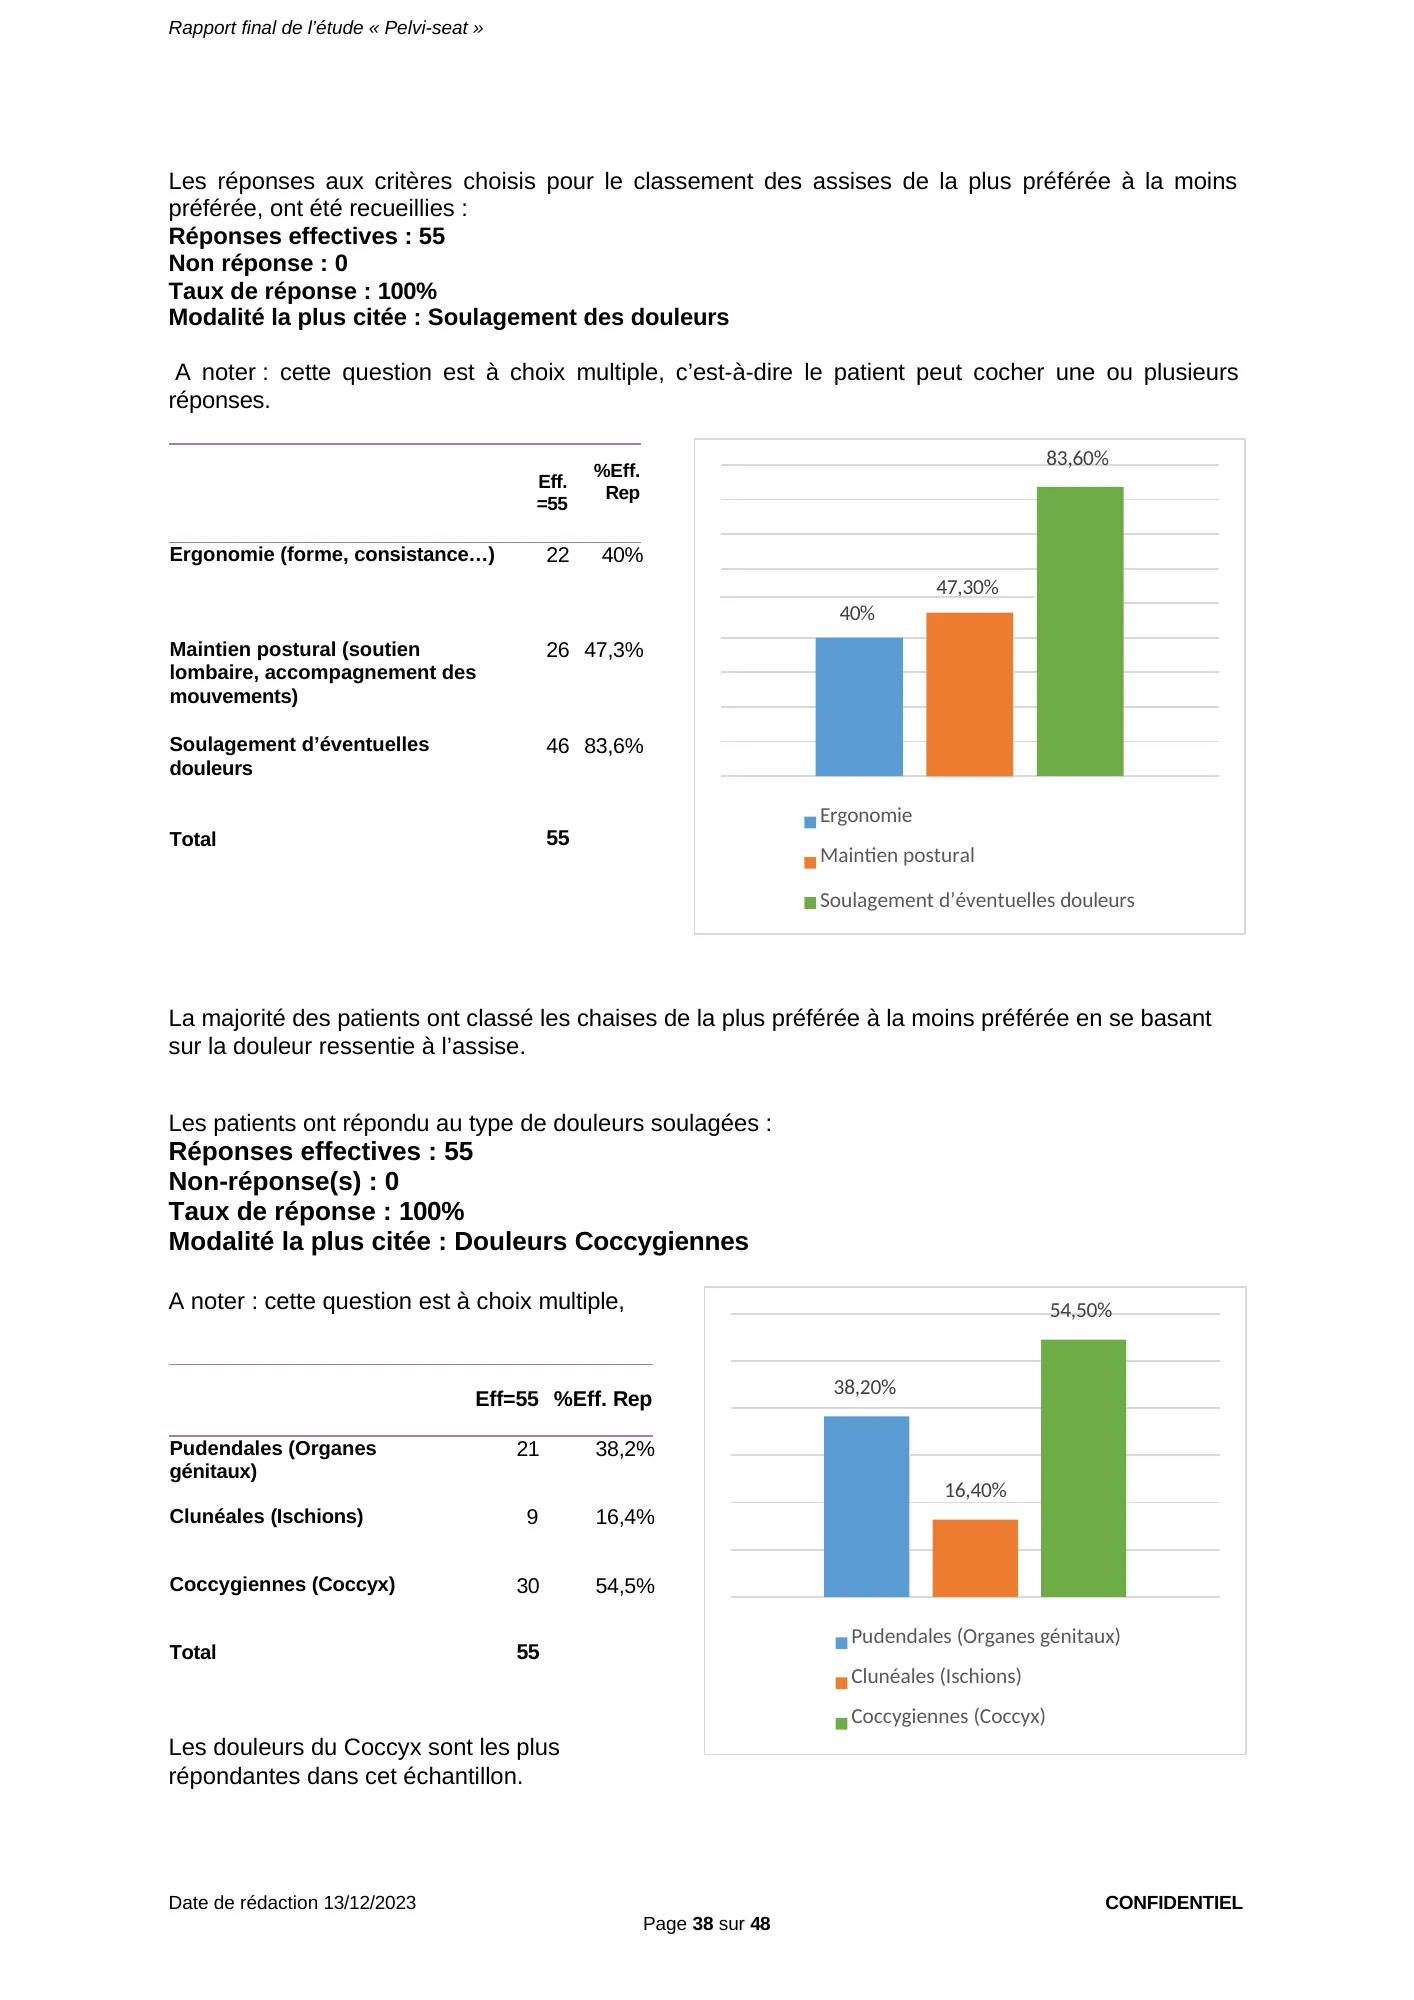
Most patients ranked the chairs from most to least preferred based on the pain felt while seated.
Patients answered on the type of pain relieved:
- Actual responses: 55
- No response(s): 0
- Response rate: 100%
- Most frequent answer: Douleurs Coccygiennes
Note: this is a multiple-choice question,
| Type of pain | Eff=55 | %Eff. Rep |
|---|---|---|
| Pudendal (genital organs) | 21 | 38.2% |
| Cluneal (ischia) | 9 | 16.4% |
| Coccygeal (coccyx) | 30 | 54.5% |
| Total | 55 |
Coccyx pain is the most frequently reported in this sample.
View the original page (page 38 of the report, in French)
Page 38 — Ranking criteria (55 patients, multiple choice): pain relief for 46 patients (83.6%); pain relieved: coccyx 30 patients (54.5%), pudendal 21 (38.2%), cluneal 9 (16.4%).
Report, page 39 of 48 — Results for the complete sample (55 questionnaires)
The breakdown of answers by preferred chair is as follows:
| Type of pain | Eff.Tot | Chair 1 (Hard) | Chair 2 (APORIA N°1) | Chair 3 (Padded) | Chair 4 (APORIA N°2) |
|---|---|---|---|---|---|
| Pudendal (genital organs) | 21 | 2 — 9.5% | 9 — 42.9% | 3 — 14.3% | 7 — 33.3% |
| Cluneal (ischia) | 9 | 2 — 22.2% | 4 — 44.4% | 0 — 0% | 3 — 33.3% |
| Coccygeal (coccyx) | 30 | 4 — 13.33% | 8 — 26.7% | 2 — 6.7% | 16 — 53.3% |
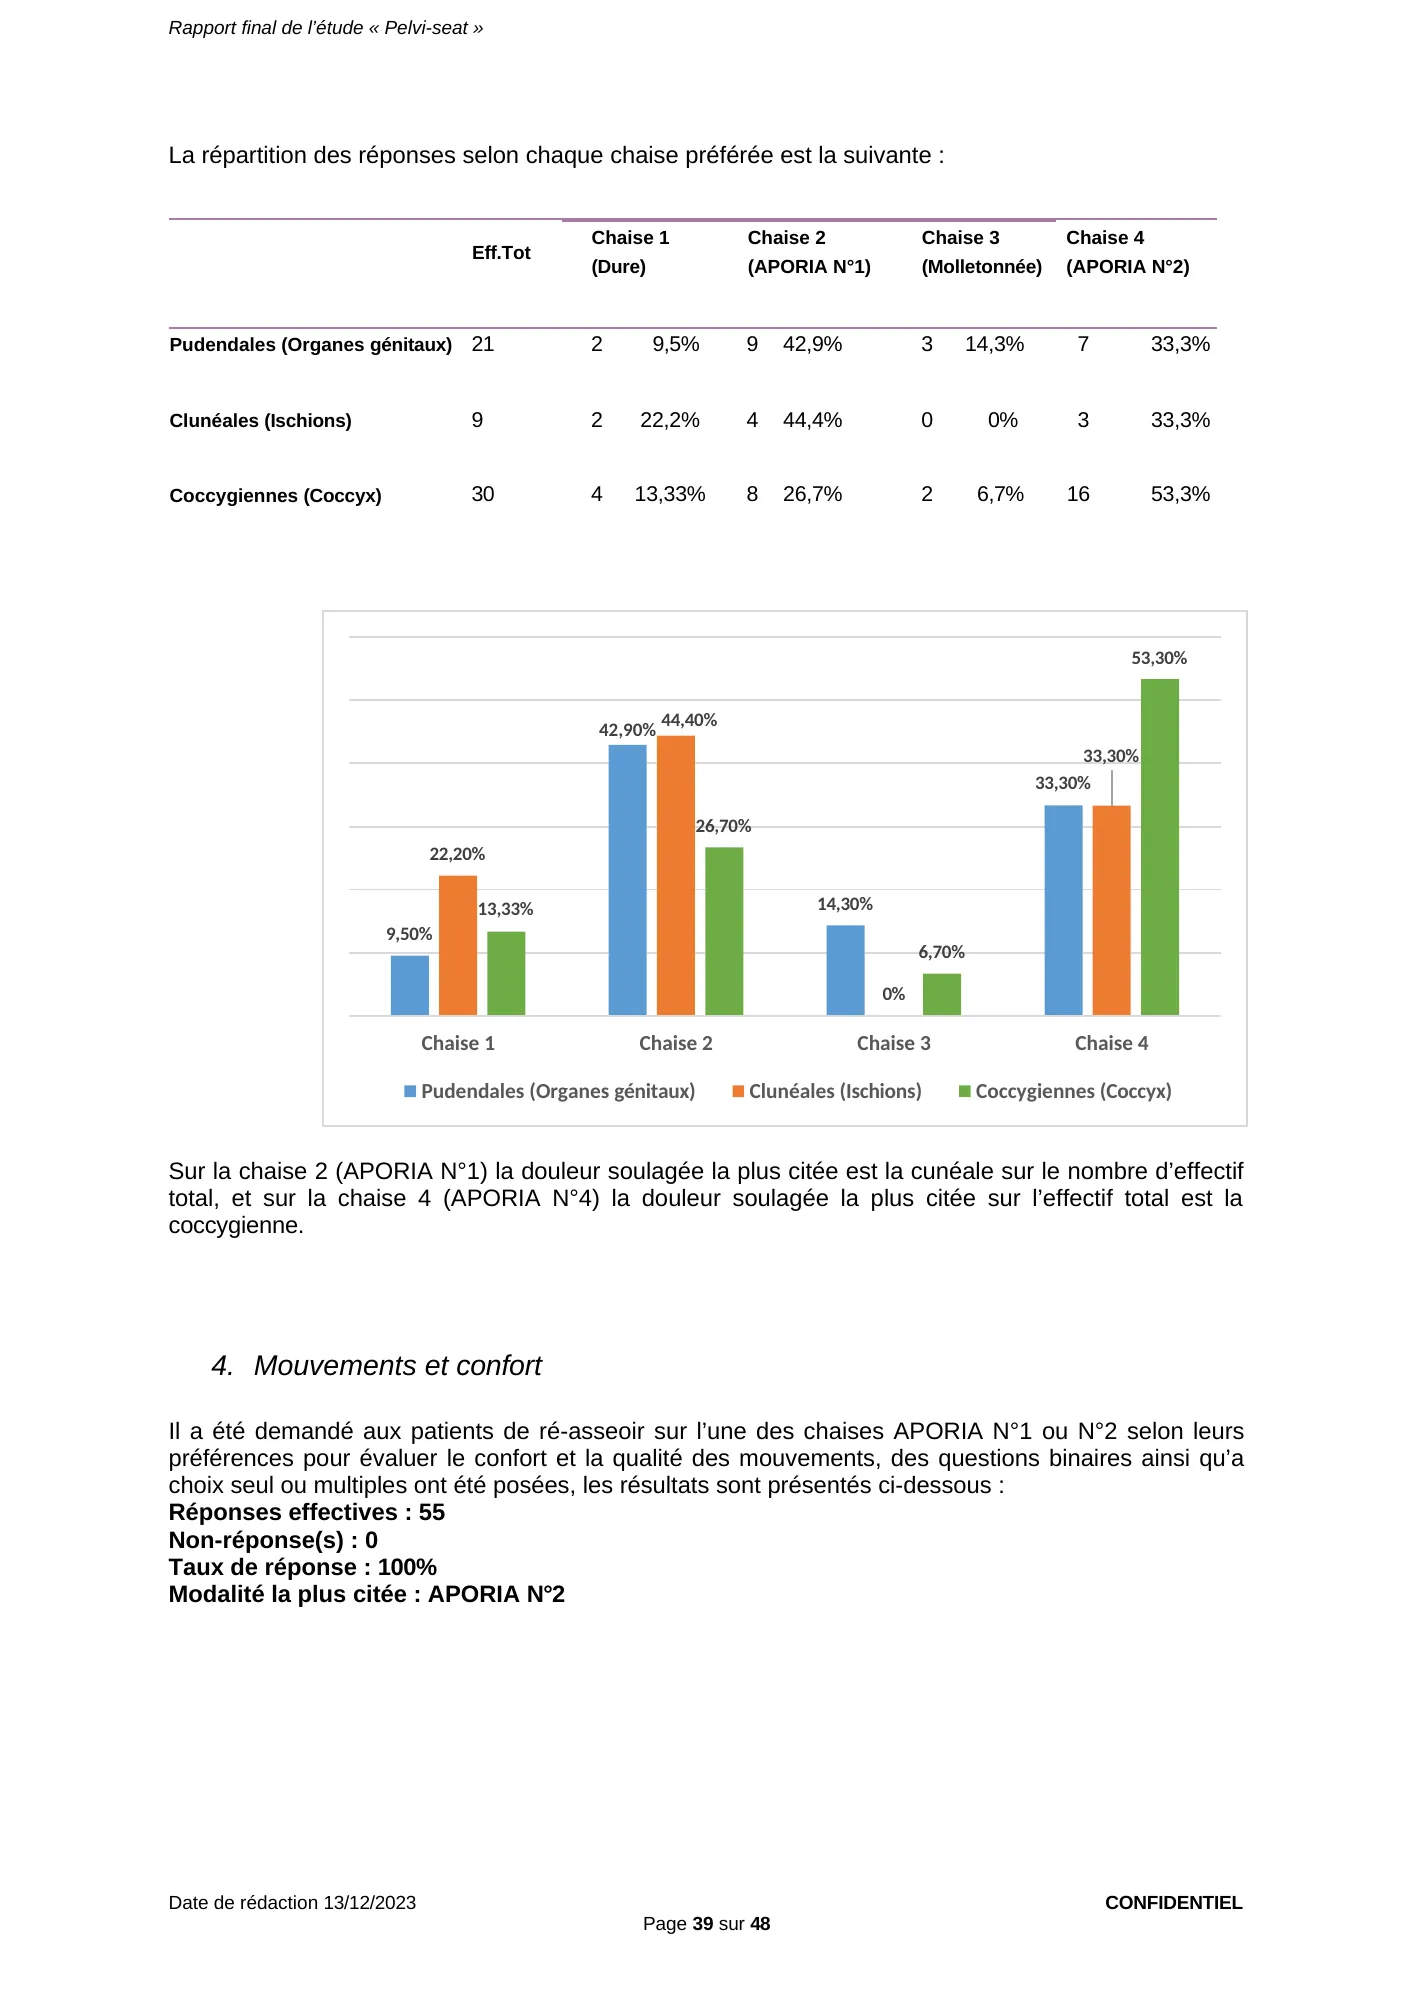
On chair 2 (APORIA N°1) the most frequently cited pain relieved is cluneal pain on the total count, and on chair 4 (APORIA N°4) the most frequently cited pain relieved on the total count is coccygeal pain.
4. Movement and comfort
Patients were asked to sit again on one of the APORIA N°1 or N°2 chairs, according to their preference, to assess comfort and quality of movement; yes/no, single-choice and multiple-choice questions were asked, and the results are presented below:
- Actual responses: 55
- No response(s): 0
- Response rate: 100%
- Most frequent answer: APORIA N°2
View the original page (page 39 of the report, in French)
Page 39 — Pain relieved by preferred seat (complete sample): Aporia® N°1 cited by 9 of 21 patients with pudendal pain (42.9%) and by 4 of 9 patients with cluneal pain (44.4%); Aporia® N°2 cited by 16 of 30 patients with coccyx pain (53.3%).
Report, page 40 of 48 — Movement and comfort, complete sample (55 questionnaires)
| Eff.=55 | %Eff. Rep | |
|---|---|---|
| APORIA N°1 | 25 | 45.5% |
| APORIA N°2 | 30 | 54.5% |
| Total | 55 | 100% |
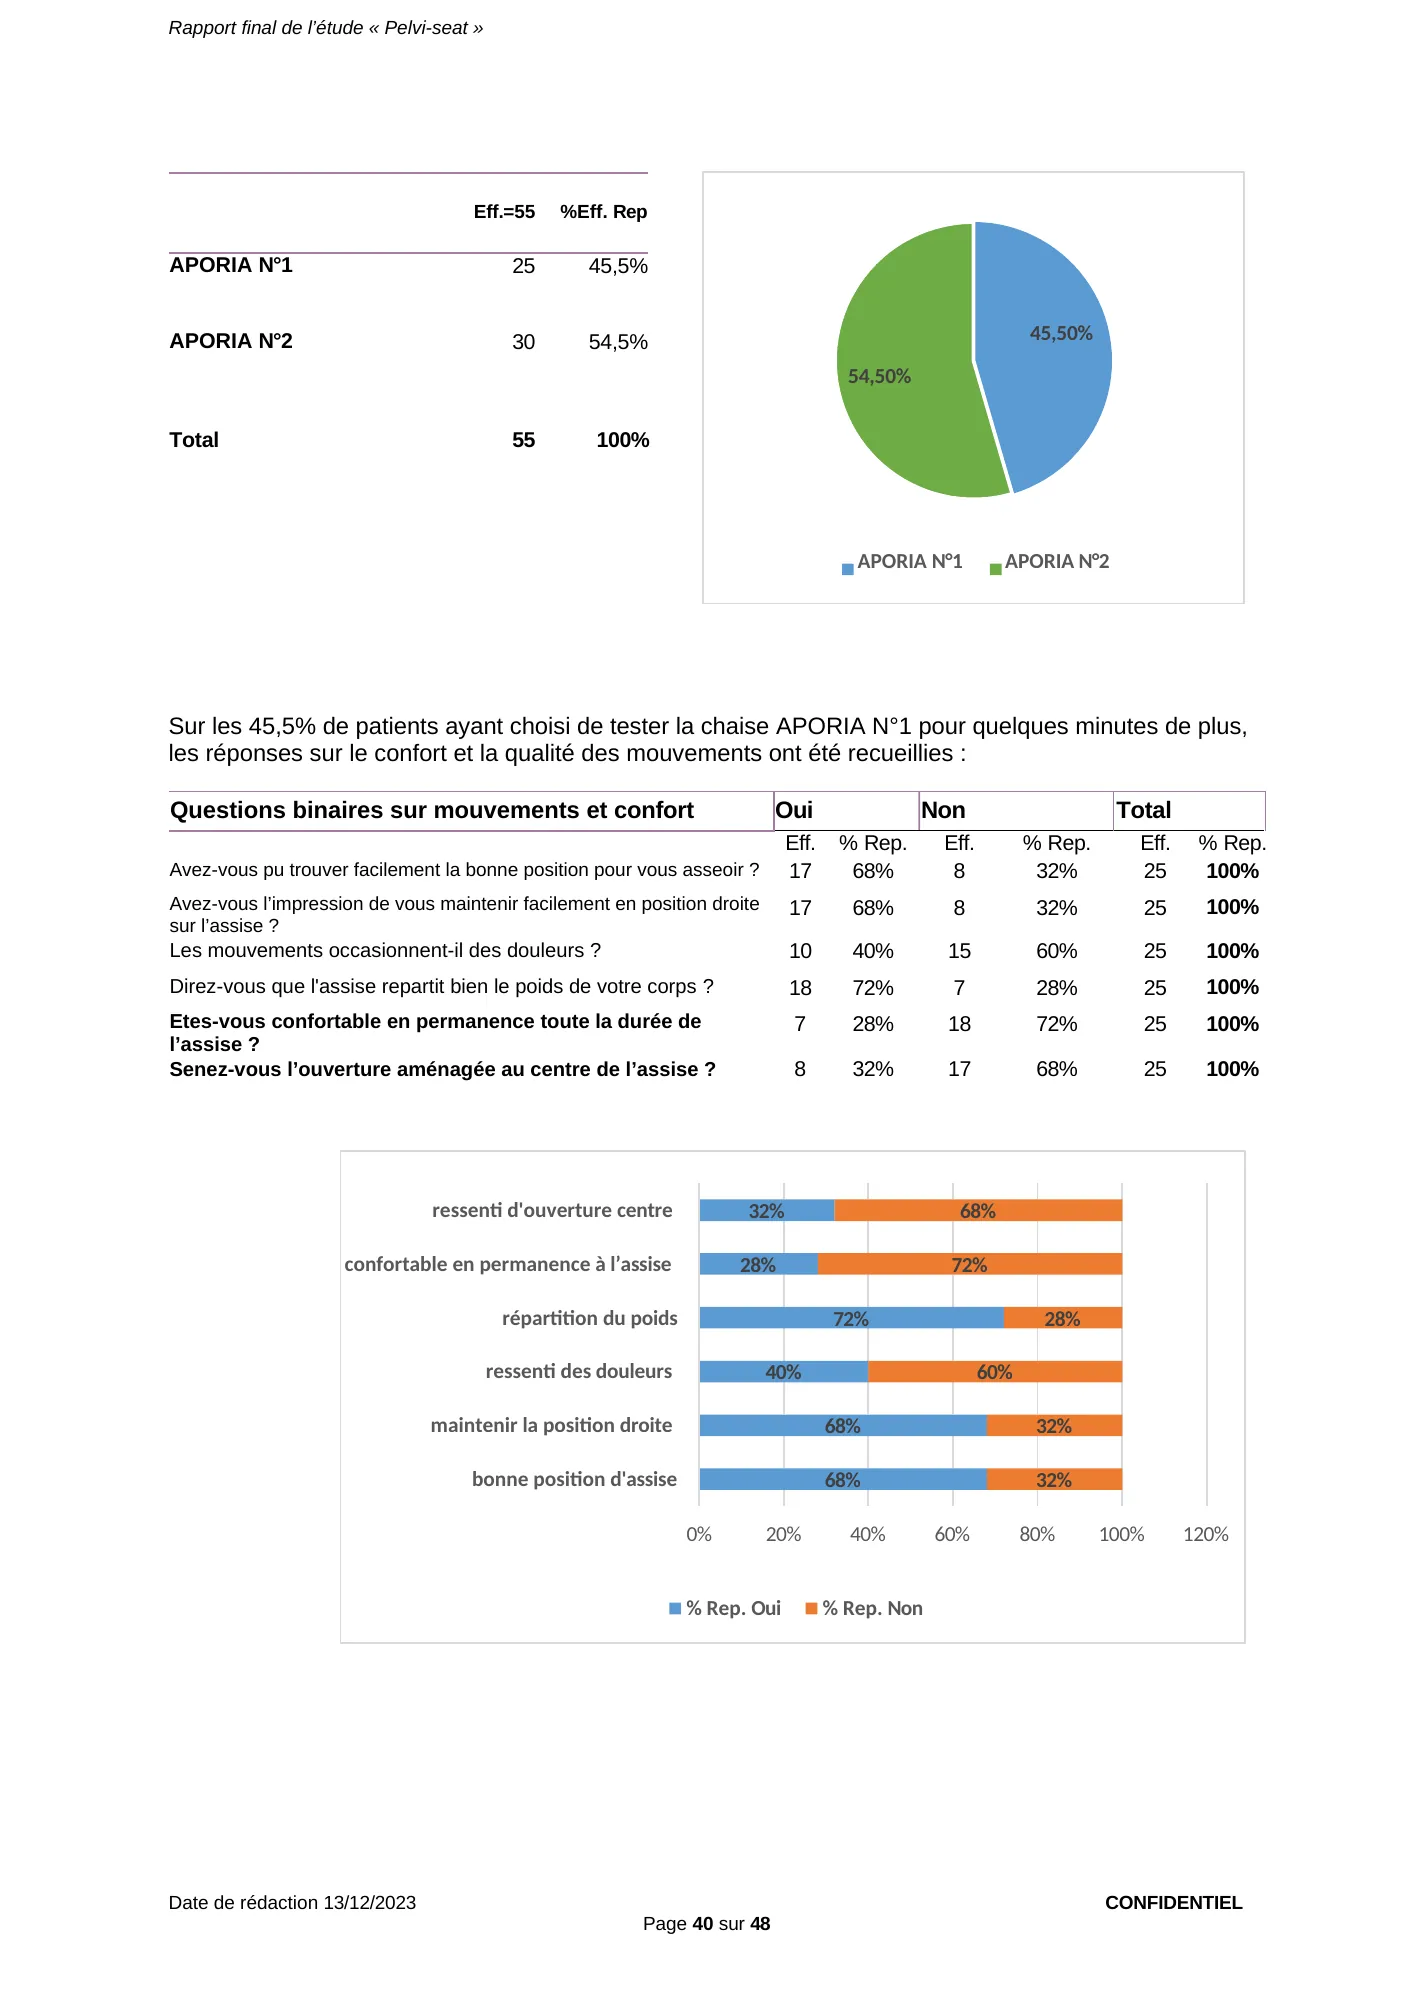
For the 45.5% of patients who chose to test the APORIA N°1 chair for a few more minutes, the answers on comfort and quality of movement were collected:
| Yes/no questions on movement and comfort | Yes Eff. | Yes % Rep. | No Eff. | No % Rep. | Total Eff. | Total % Rep. |
|---|---|---|---|---|---|---|
| Could you easily find the right sitting position? | 17 | 68% | 8 | 32% | 25 | 100% |
| Do you feel you can easily stay upright on the seat? | 17 | 68% | 8 | 32% | 25 | 100% |
| Do movements cause pain? | 10 | 40% | 15 | 60% | 25 | 100% |
| Would you say the seat distributes your body weight well? | 18 | 72% | 7 | 28% | 25 | 100% |
| Are you comfortable the whole time you are seated? | 7 | 28% | 18 | 72% | 25 | 100% |
| Do you feel the opening in the center of the seat? | 8 | 32% | 17 | 68% | 25 | 100% |
View the original page (page 40 of the report, in French)
Page 40 — Movement and comfort on the Aporia® N°1 (25 patients, complete sample): 18 find the weight well distributed (72%), 17 easily find the right position (68%).
Report, page 41 of 48 — Movement and comfort, complete sample (55 questionnaires)
| Yes/no questions on movement and comfort | Yes Eff. | Yes % Rep. | No Eff. | No % Rep. | Total Eff. | Total % Rep. |
|---|---|---|---|---|---|---|
| Could you easily find the right sitting position? | 23 | 76.7% | 7 | 23.3% | 30 | 100% |
| Do you feel you can easily stay upright on the seat? | 22 | 73.3% | 8 | 26.7% | 30 | 100% |
| Do movements cause pain? | 13 | 43.3% | 17 | 56.7% | 30 | 100% |
| Would you say the seat distributes your body weight well? | 22 | 73.3% | 8 | 26.7% | 30 | 100% |
| Are you comfortable the whole time you are seated? | 15 | 50% | 15 | 50% | 30 | 100% |
| Do you feel the opening in the center of the seat? | 12 | 40% | 18 | 60% | 30 | 100% |
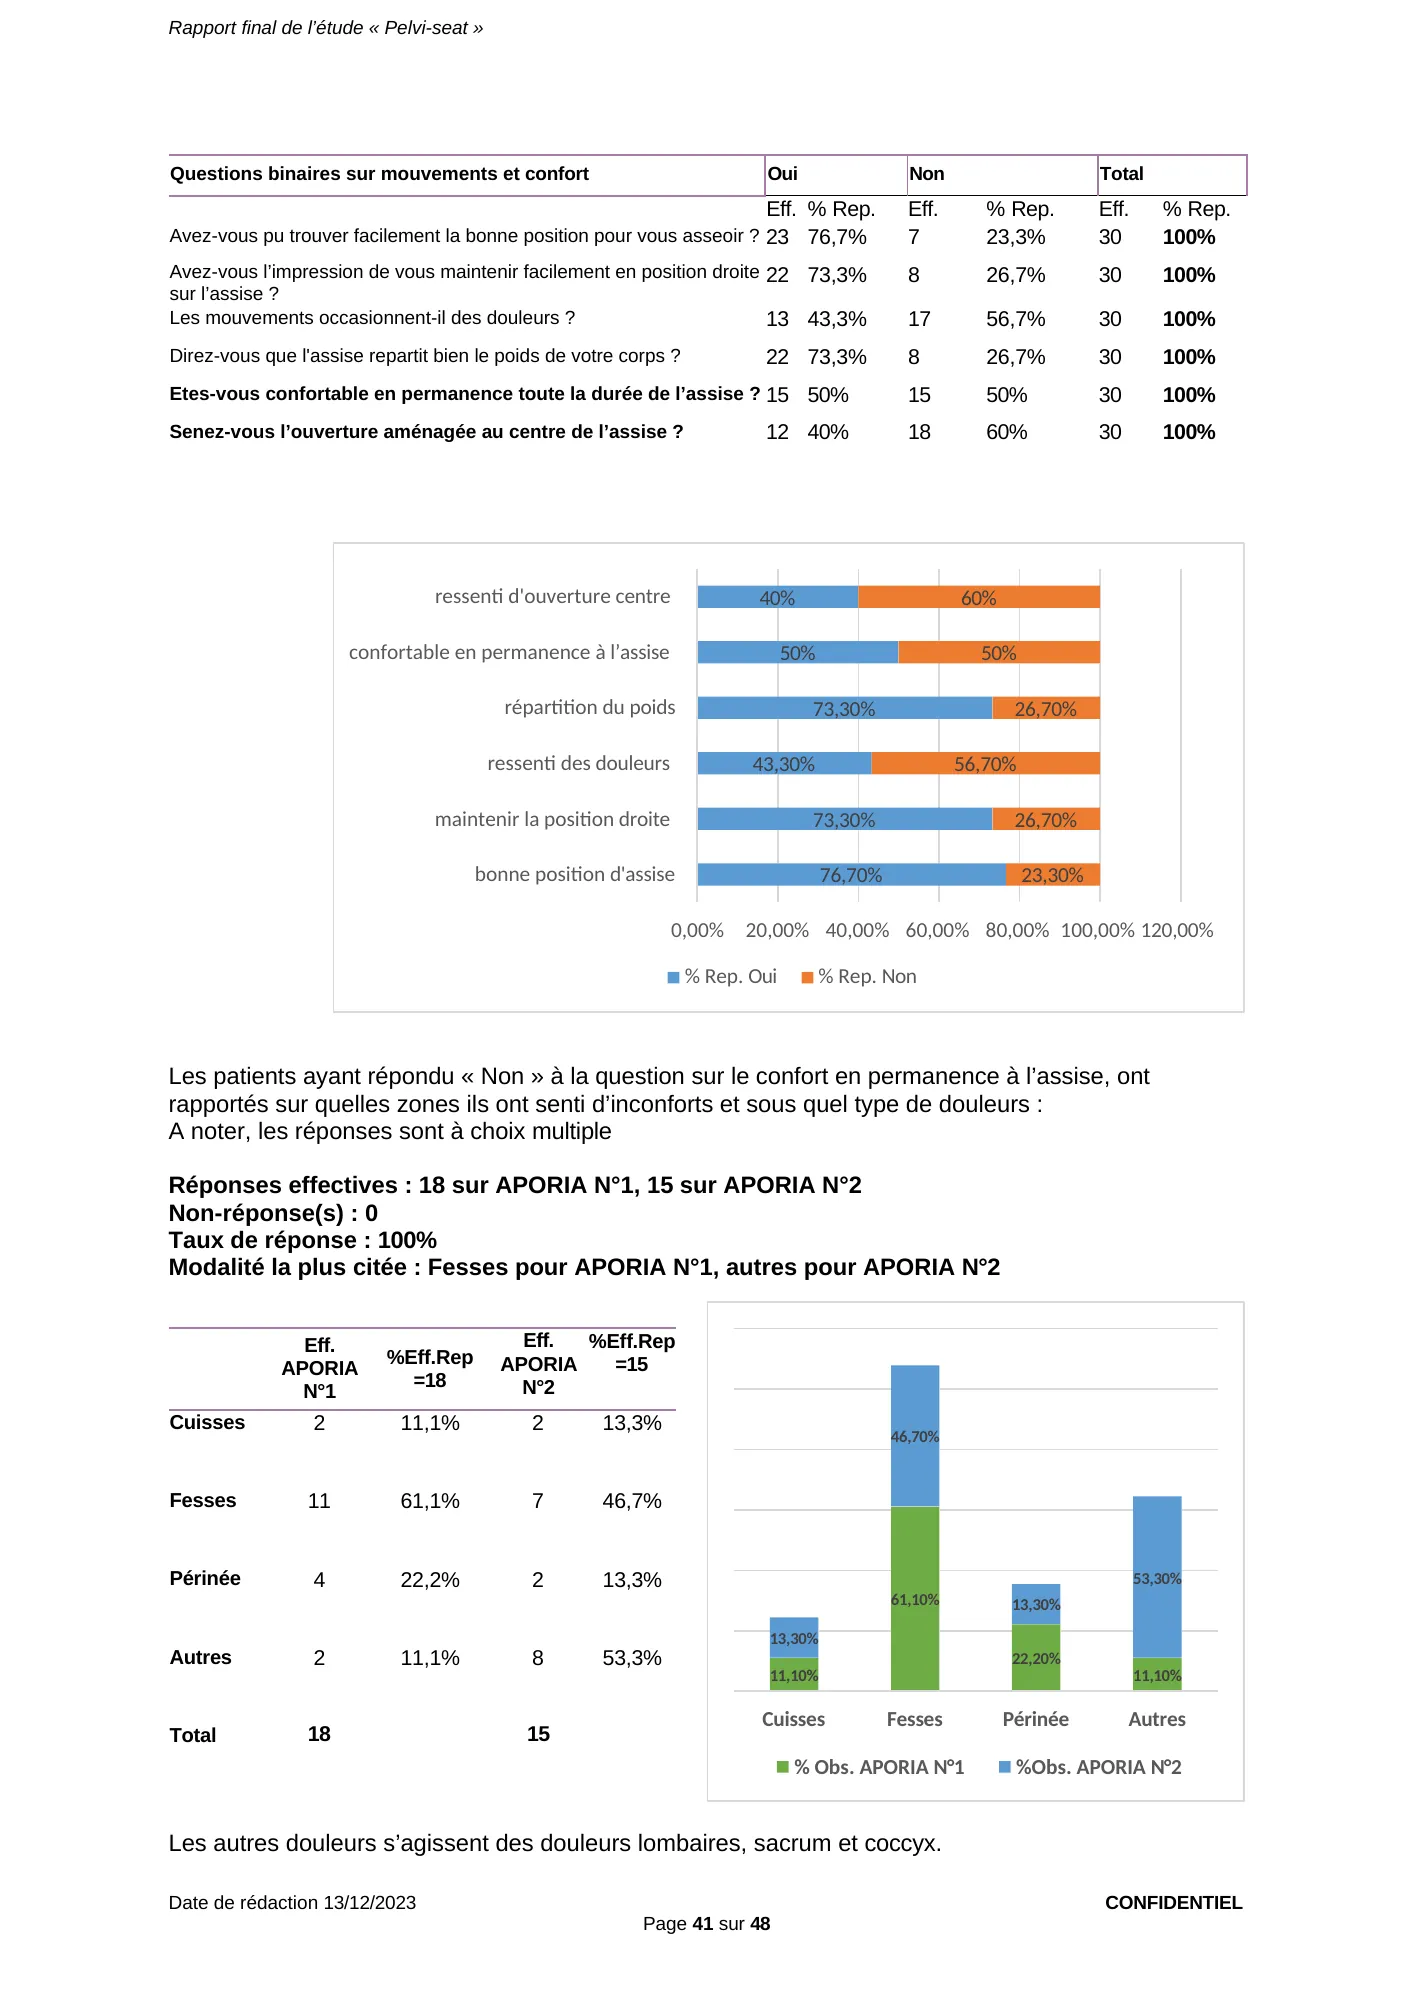
Patients who answered “No” to the question on being comfortable the whole time reported in which areas they felt discomfort and what type of pain:
Note: answers are multiple-choice
- Actual responses: 18 for APORIA N°1, 15 for APORIA N°2
- No response(s): 0
- Response rate: 100%
- Most frequent answer: Buttocks for APORIA N°1, other for APORIA N°2
| Area | Eff. APORIA N°1 | %Eff.Rep =18 | Eff. APORIA N°2 | %Eff.Rep =15 |
|---|---|---|---|---|
| Thighs | 2 | 11.1% | 2 | 13.3% |
| Buttocks | 11 | 61.1% | 7 | 46.7% |
| Perineum | 4 | 22.2% | 2 | 13.3% |
| Other | 2 | 11.1% | 8 | 53.3% |
| Total | 18 | 15 |
The other pain consists of lower-back, sacrum and coccyx pain.
View the original page (page 41 of the report, in French)
Page 41 — Movement and comfort on the Aporia® N°2 (30 patients, complete sample): 23 easily find the right position (76.7%), 22 stay upright (73.3%).
Report, page 42 of 48 — Type of discomfort and central opening, complete sample (55 questionnaires)
The types of discomfort felt by patients are shown below:
- Actual responses: 18 for APORIA N°1, 15 for APORIA N°2
- No response(s): 0
- Response rate: 100%
- Most frequent answer: Diffuse pain for APORIA N°1, Pressure points for APORIA N°2
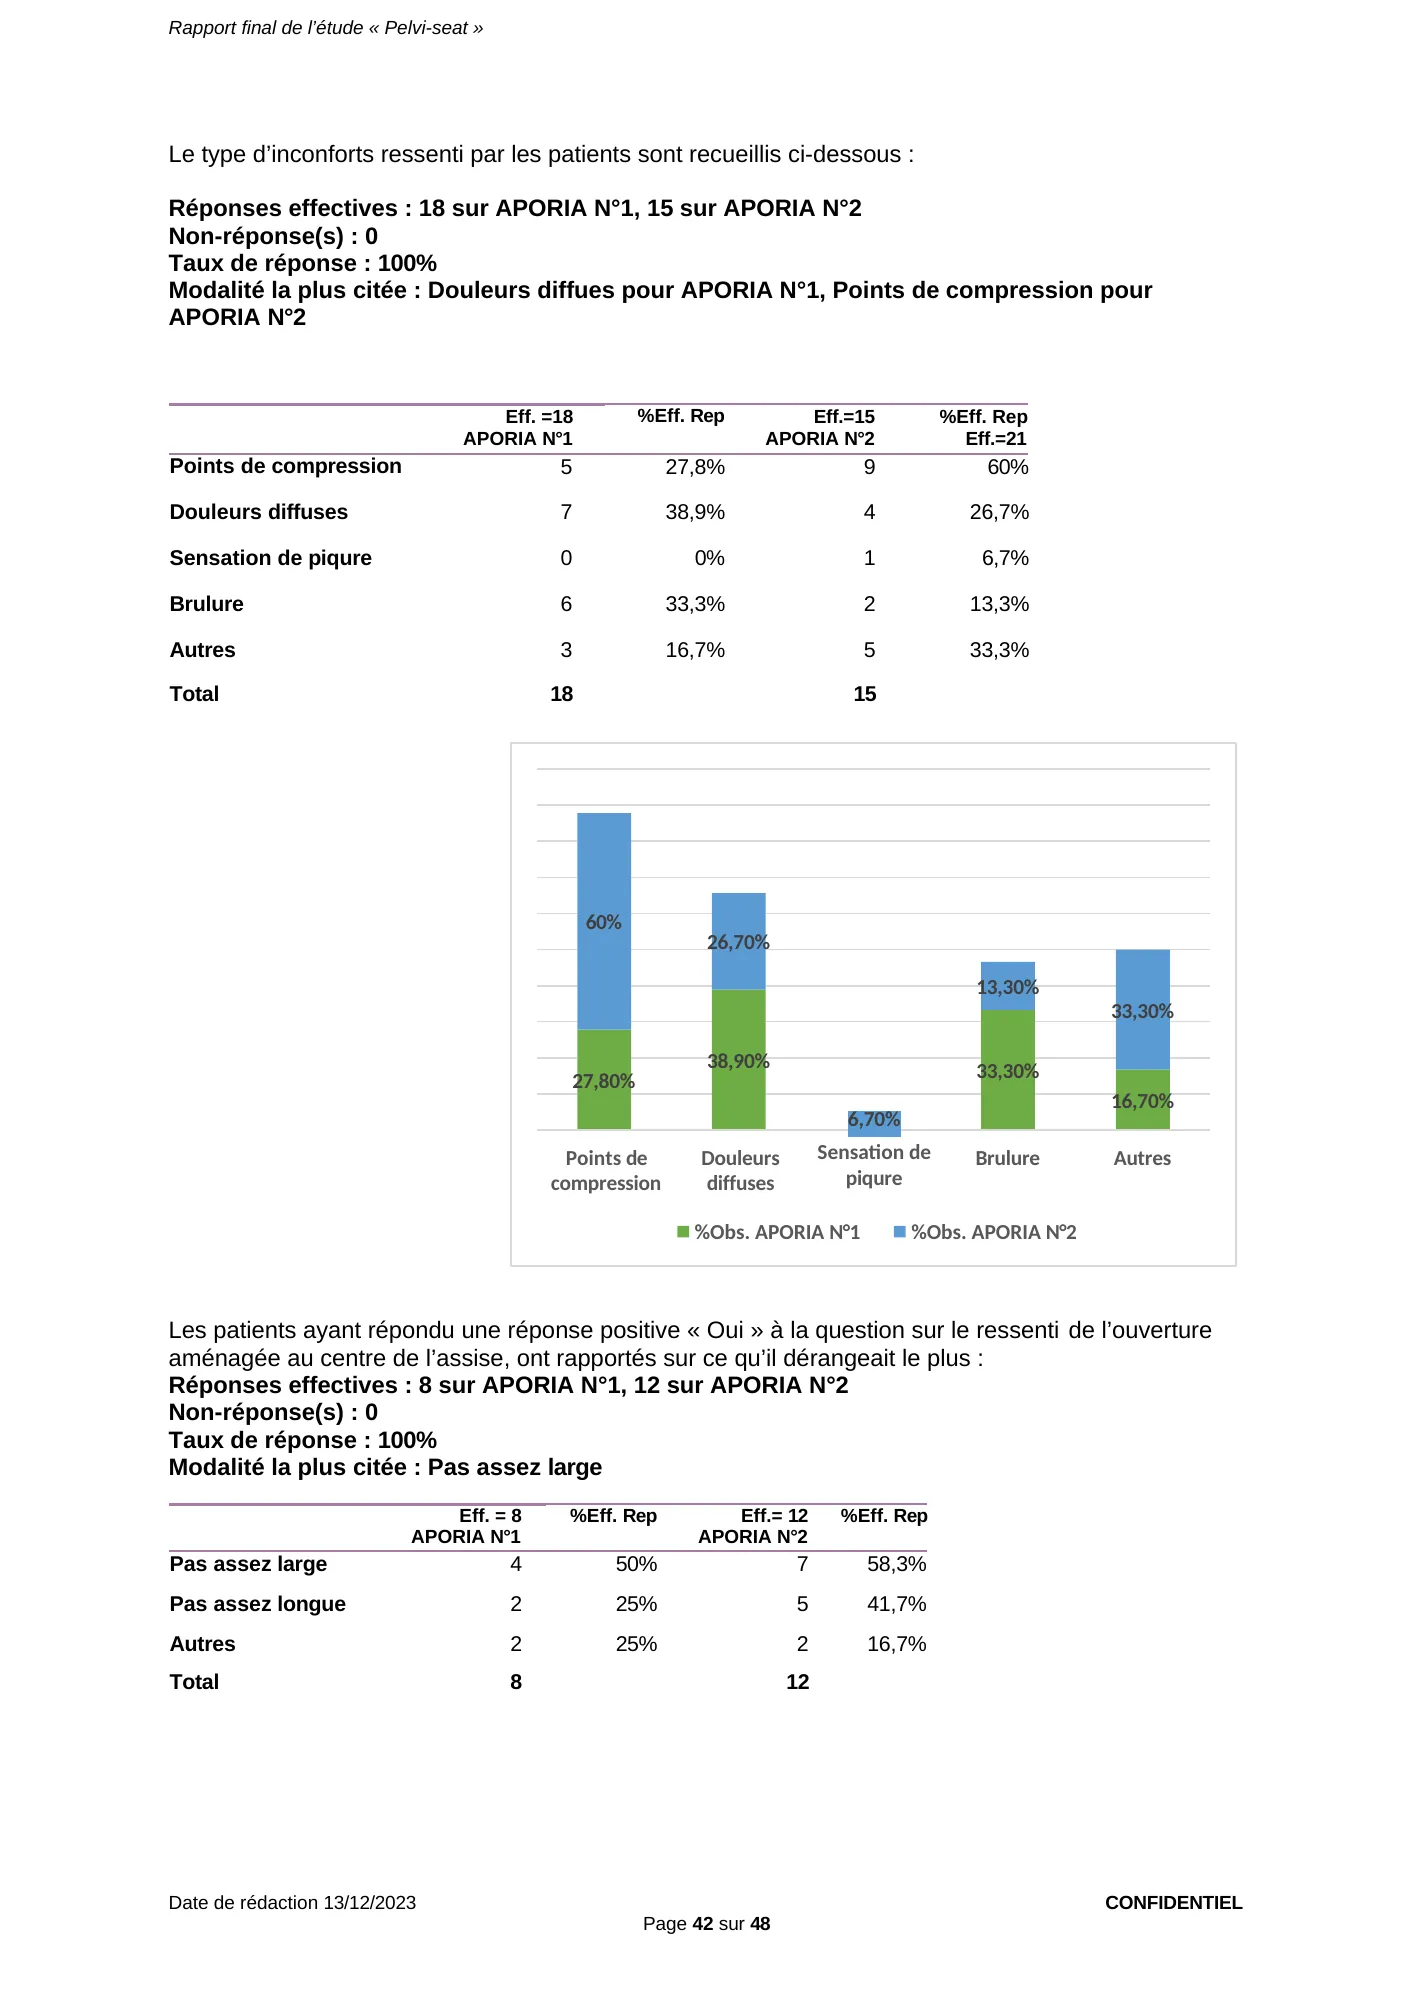
| Type | Eff. = 18 APORIA N°1 | %Eff. Rep | Eff. = 15 APORIA N°2 | %Eff. Rep Eff.=21 |
|---|---|---|---|---|
| Pressure points | 5 | 27.8% | 9 | 60% |
| Diffuse pain | 7 | 38.9% | 4 | 26.7% |
| Stinging sensation | 0 | 0% | 1 | 6.7% |
| Burning | 6 | 33.3% | 2 | 13.3% |
| Other | 3 | 16.7% | 5 | 33.3% |
| Total | 18 | 15 |
Patients who answered “Yes” to the question on feeling the opening in the center of the seat reported what bothered them most:
- Actual responses: 8 for APORIA N°1, 12 for APORIA N°2
- No response(s): 0
- Response rate: 100%
- Most frequent answer: Not wide enough
| Answer | Eff. = 8 APORIA N°1 | %Eff. Rep | Eff. = 12 APORIA N°2 | %Eff. Rep |
|---|---|---|---|---|
| Not wide enough | 4 | 50% | 7 | 58.3% |
| Not long enough | 2 | 25% | 5 | 41.7% |
| Other | 2 | 25% | 2 | 16.7% |
| Total | 8 | 12 |
View the original page (page 42 of the report, in French)
Page 42 — Types of discomfort on Aporia® N°1 and N°2 (pressure points, diffuse pain) and comments on the central opening.
Report, page 43 of 48 — Central opening and range of movement, complete sample (55 questionnaires)
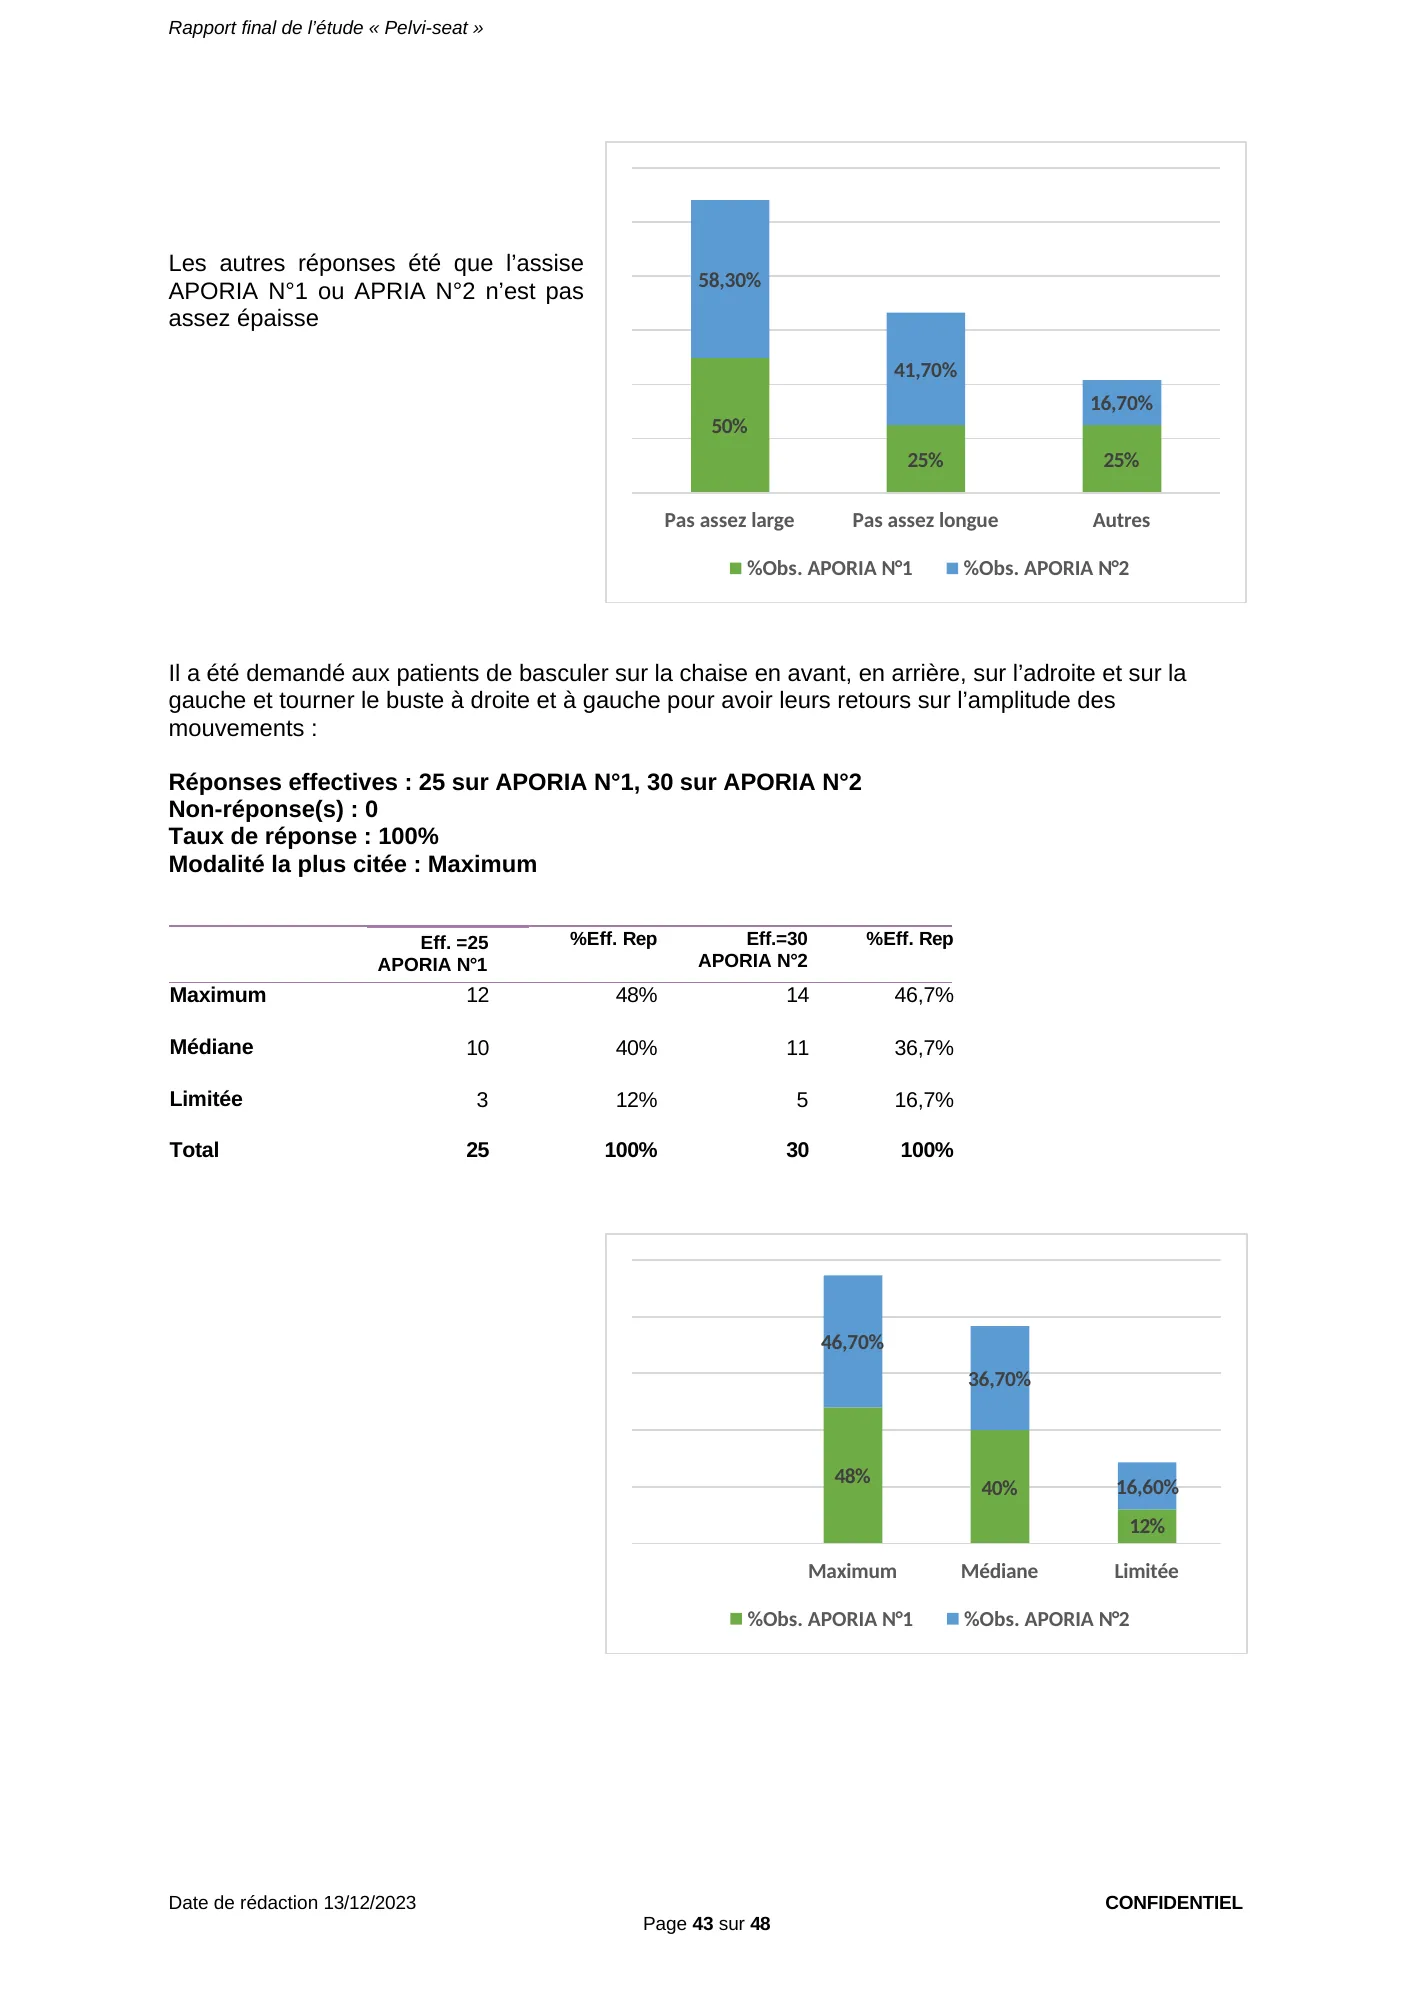
The other answers were that the APORIA N°1 or APRIA N°2 seat is not thick enough
Patients were asked to tilt forward, backward, to the right and to the left on the chair, and to rotate the trunk to the right and to the left, to give feedback on the range of movement:
- Actual responses: 25 for APORIA N°1, 30 for APORIA N°2
- No response(s): 0
- Response rate: 100%
- Most frequent answer: Maximum
| Range | Eff. = 25 APORIA N°1 | %Eff. Rep | Eff. = 30 APORIA N°2 | %Eff. Rep |
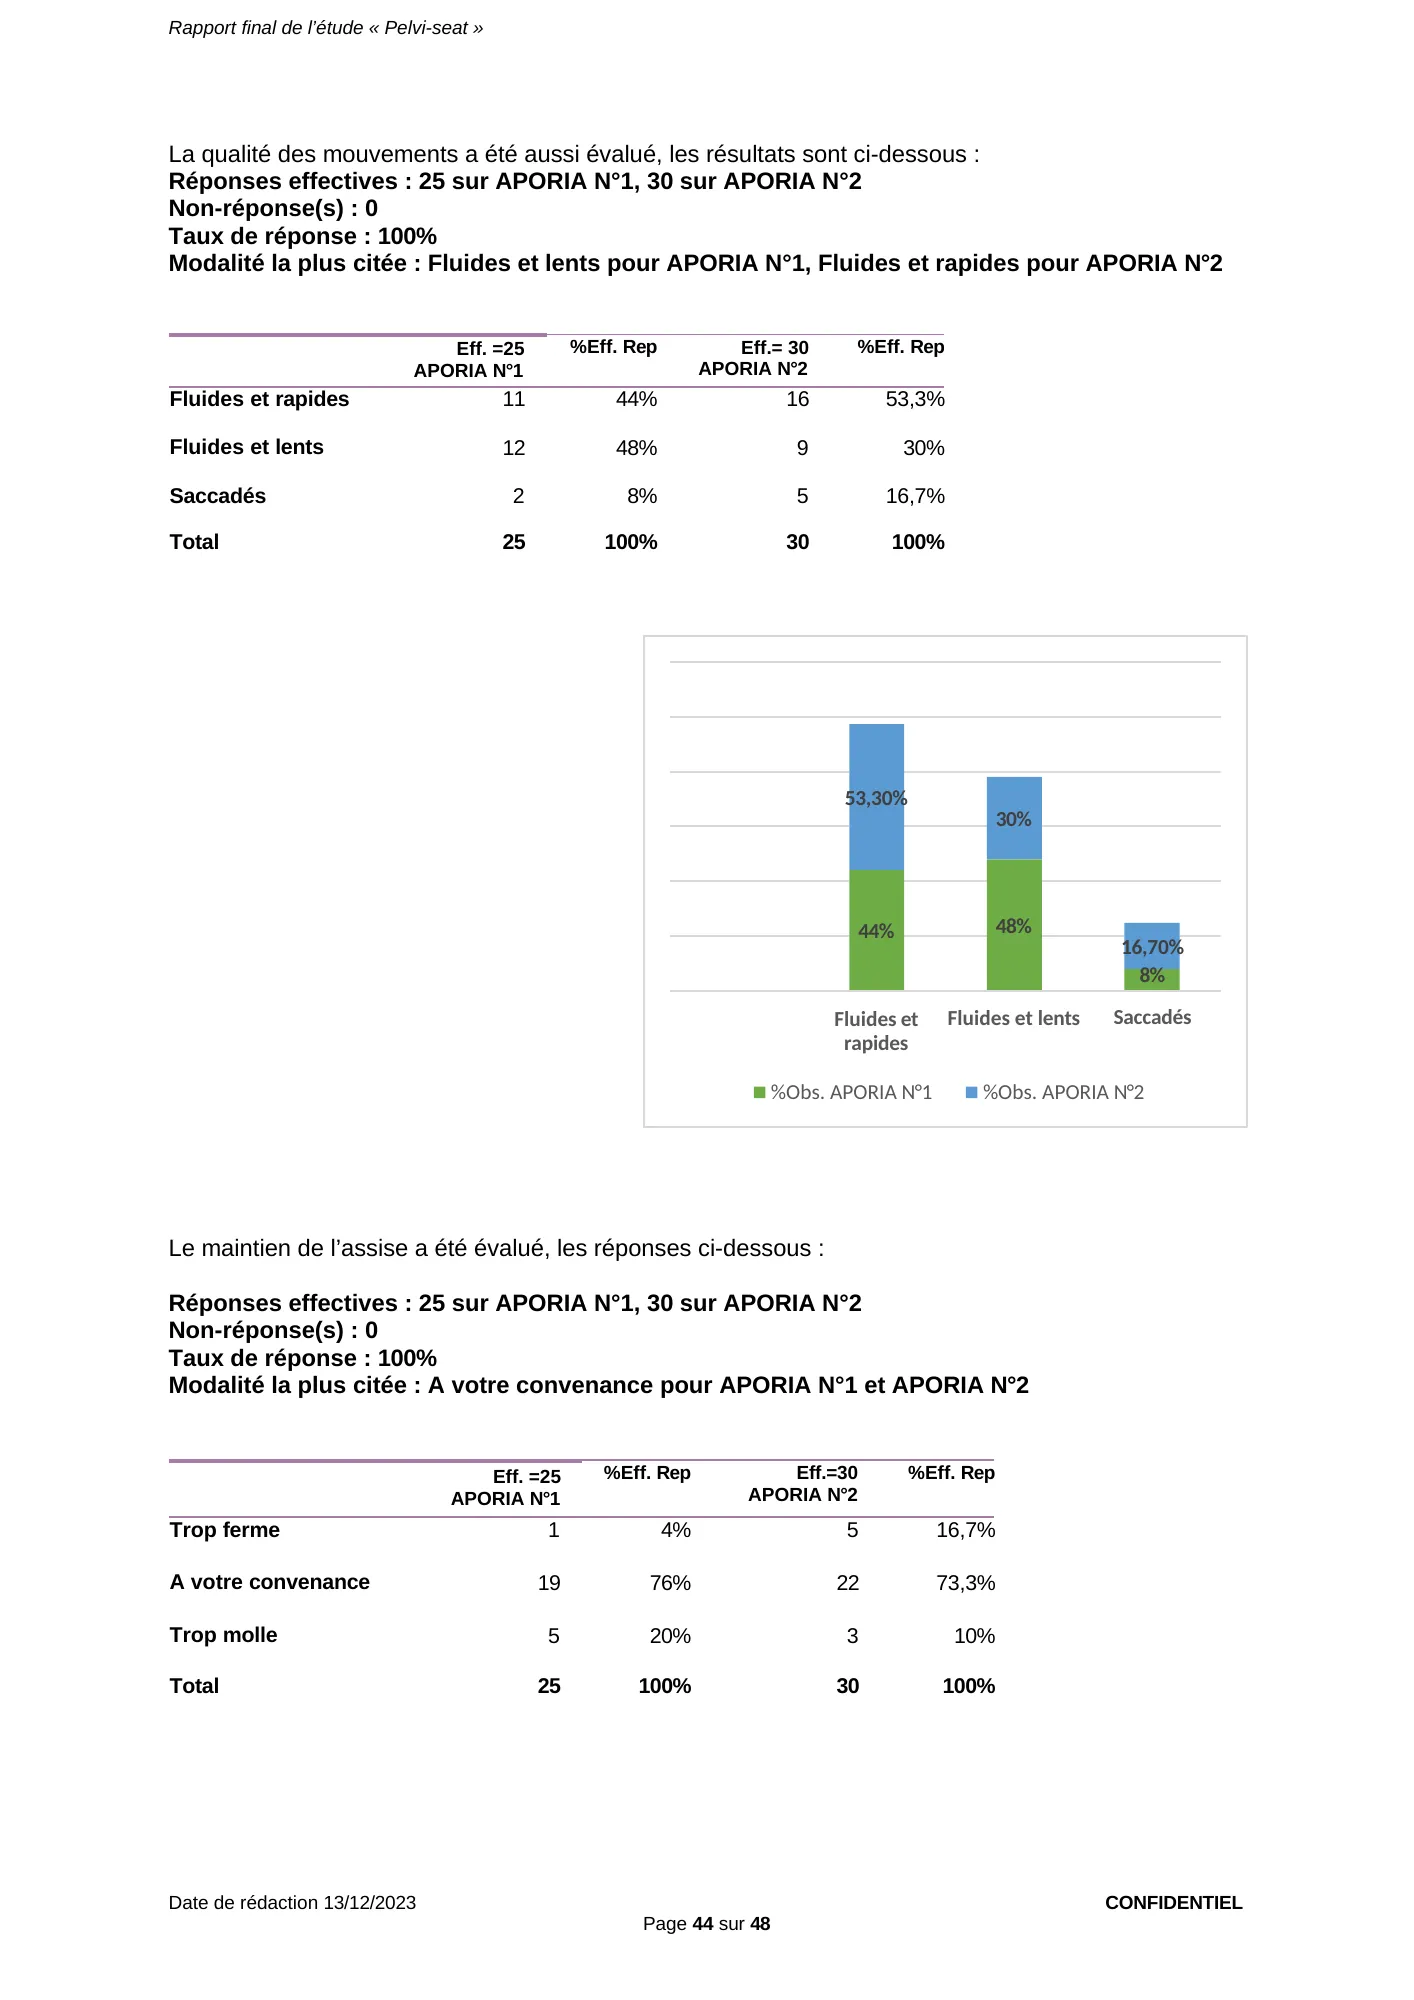
|---|---|---|---|---|
| Maximum | 12 | 48% | 14 | 46.7% |
| Medium | 10 | 40% | 11 | 36.7% |
| Limited | 3 | 12% | 5 | 16.7% |
| Total | 25 | 100% | 30 | 100% |
View the original page (page 43 of the report, in French)
Page 43 — Range of pelvic and trunk movement judged maximal by 12 of 25 patients (Aporia® N°1) and 14 of 30 (Aporia® N°2).
Report, page 44 of 48 — Quality of movement and support, complete sample (55 questionnaires)
The quality of movement was also assessed; the results are below:
- Actual responses: 25 for APORIA N°1, 30 for APORIA N°2
- No response(s): 0
- Response rate: 100%
- Most frequent answer: Smooth and slow for APORIA N°1, Smooth and quick for APORIA N°2
| Answer | Eff. = 25 APORIA N°1 | %Eff. Rep | Eff. = 30 APORIA N°2 | %Eff. Rep |
|---|---|---|---|---|
| Smooth and quick | 11 | 44% | 16 | 53.3% |
| Smooth and slow | 12 | 48% | 9 | 30% |
| Jerky | 2 | 8% | 5 | 16.7% |
| Total | 25 | 100% | 30 | 100% |
Seat support was assessed; the answers are below:
- Actual responses: 25 for APORIA N°1, 30 for APORIA N°2
- No response(s): 0
- Response rate: 100%
- Most frequent answer: Just right for APORIA N°1 and APORIA N°2
| Answer | Eff. = 25 APORIA N°1 | %Eff. Rep | Eff. = 30 APORIA N°2 | %Eff. Rep |
|---|---|---|---|---|
| Too firm | 1 | 4% | 5 | 16.7% |
| Just right | 19 | 76% | 22 | 73.3% |
| Too soft | 5 | 20% | 3 | 10% |
| Total | 25 | 100% | 30 | 100% |
View the original page (page 44 of the report, in French)
Page 44 — Quality of movement and firmness (complete sample): Aporia® N°1 “just right” for 19 of 25 patients (76%), Aporia® N°2 for 22 of 30 (73.3%).
Report, page 45 of 48 — Comfort compared with everyday cushions, complete sample (55 questionnaires)
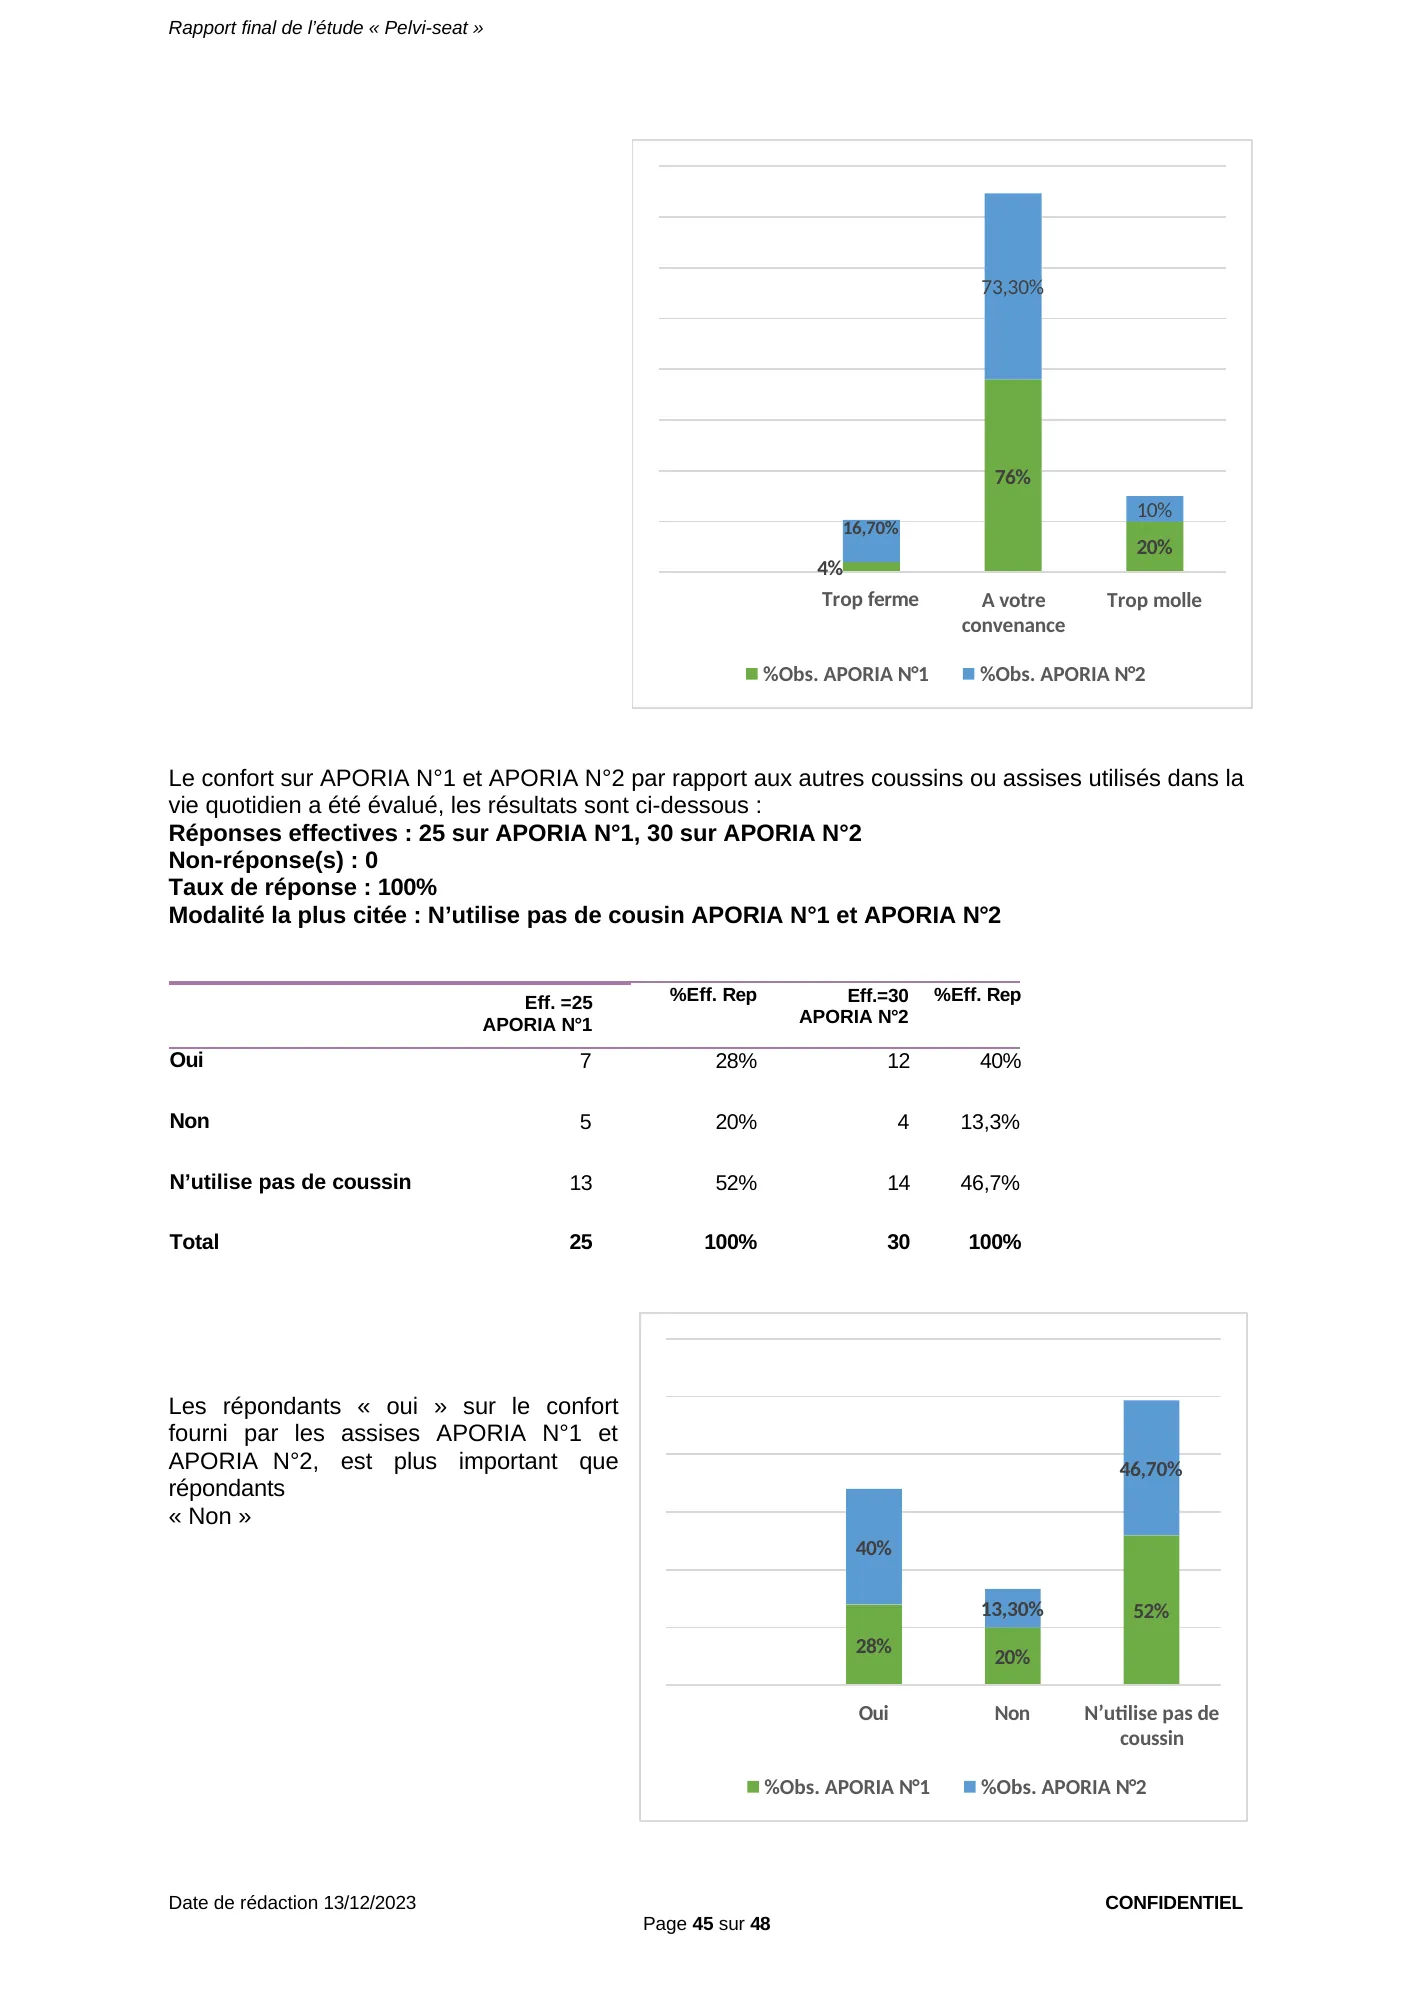
Comfort on APORIA N°1 and APORIA N°2 compared with other cushions or seats used in daily life was assessed; the results are below:
- Actual responses: 25 for APORIA N°1, 30 for APORIA N°2
- No response(s): 0
- Response rate: 100%
- Most frequent answer: Does not use a cushion APORIA N°1 and APORIA N°2
“Yes” answers on the comfort provided by the APORIA N°1 and APORIA N°2 seats outnumber “No” answers
| Answer | Eff. = 25 APORIA N°1 | %Eff. Rep | Eff. = 30 APORIA N°2 | %Eff. Rep |
|---|---|---|---|---|
| Yes | 7 | 28% | 12 | 40% |
| No | 5 | 20% | 4 | 13.3% |
| Does not use a cushion | 13 | 52% | 14 | 46.7% |
| Total | 25 | 100% | 30 | 100% |
View the original page (page 45 of the report, in French)
Page 45 — Comfort compared with everyday cushions (complete sample): “yes” for 7 of 25 patients (Aporia® N°1) and 12 of 30 (Aporia® N°2), versus 5 and 4 “no”.
Report, page 46 of 48 — Relief of other pain, complete sample (55 questionnaires)
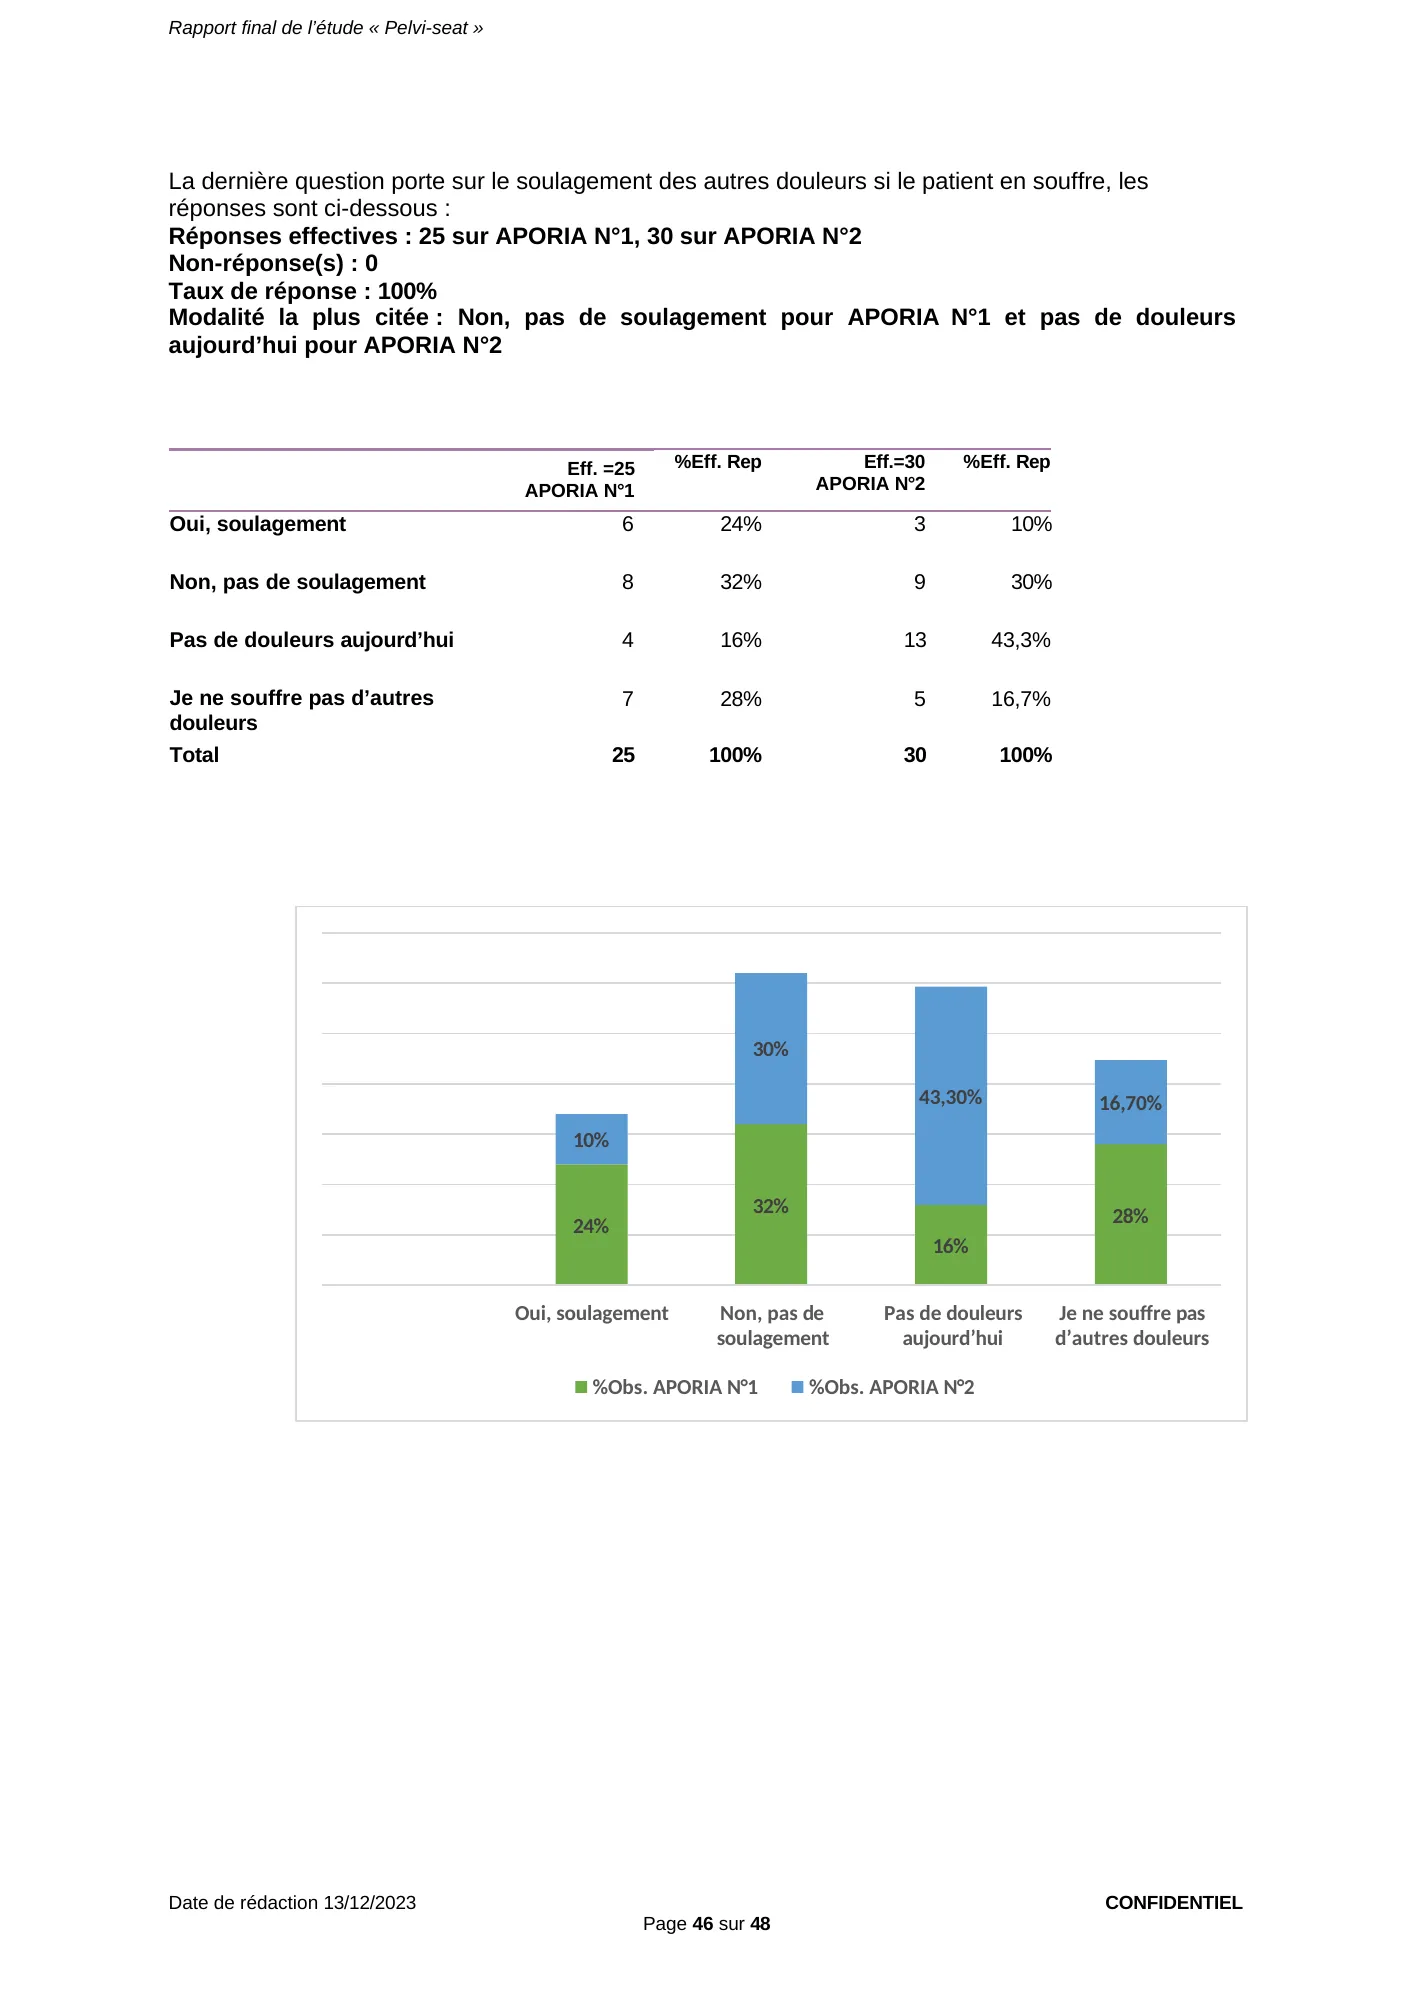
The last question concerns the relief of other pain, if the patient suffers from any; the answers are below:
- Actual responses: 25 for APORIA N°1, 30 for APORIA N°2
- No response(s): 0
- Response rate: 100%
- Most frequent answer: No, no relief for APORIA N°1 and no pain today for APORIA N°2
| Answer | Eff. = 25 APORIA N°1 | %Eff. Rep | Eff. = 30 APORIA N°2 | %Eff. Rep |
|---|---|---|---|---|
| Yes, relief | 6 | 24% | 3 | 10% |
| No, no relief | 8 | 32% | 9 | 30% |
| No pain today | 4 | 16% | 13 | 43.3% |
| I do not suffer from other pain | 7 | 28% | 5 | 16.7% |
| Total | 25 | 100% | 30 | 100% |
View the original page (page 46 of the report, in French)
Page 46 — Relief of other pain (complete sample): “yes” for 6 of 25 patients (Aporia® N°1) and 3 of 30 (Aporia® N°2).
Report, page 47 of 48 — Discussion and conclusion
III.[II.] Discussion and Conclusion
The results of the questionnaires collected for this study are presented in this report for two subgroups: the total sample of 95 questionnaires, with incomplete answers for several variables, and the complete sample of 55 questionnaires, with a 100% response rate for the variables/questions asked.
The complete sample can be considered a representative sample on which comparisons between data are more reliable.
Based on the complete sample alone, patients appear to be satisfied with the APORIA N°1 and APORIA N°2 seats compared with the other two chairs usually found in the waiting room. The preferred chair is APORIA N°2 with 43.6% of votes, followed by APORIA N°1 with 34.6%, versus 10.9% of votes for the hard and padded chairs.
The APORIA N°1 and APORIA N°2 seats also appear to offer greater comfort than the cushions or other products used by patients in daily life.
Regarding pain relief, the APORIA N°1 seat appears to relieve cluneal and pudendal pain, and the APORIA N°2 seat appears to relieve coccyx pain, but it is difficult to draw conclusions about other types of pain patients may suffer from. The APORIA N°1 and APORIA N°2 seats were developed to relieve pudendal and coccygeal pain respectively, and the results of this study point in that direction.
However, the evaluation time is limited, and a study in real-life conditions (at work, at the patient’s home) with a more robust methodology (crossover, randomized) is needed to confirm the value of using the APORIA seats for patients with chronic pelvic-perineal pain related to the sitting position.
View the original page (page 47 of the report, in French)
Page 47 — Discussion and conclusion: in the complete sample (55 patients), Aporia® N°2 preferred by 43.6% and Aporia® N°1 by 34.6%, versus 10.9% for each of the other two chairs; Aporia® N°1 appears to relieve pudendal and cluneal pain, Aporia® N°2 coccyx pain; a randomized real-life study is still needed.
Report, page 48 of 48 — Signature of the study lead
View the original page (page 48 of the report, in French)
Page 48 — Signature page of the report by the study lead, Dr Amélie Seneau Lévesque, on December 13, 2023.
